
One of our tasks last week was to make a diagram that provides an overview of our project’s methods, pictured below. The blue represents inputs, the yellow represents a function (our semi-supervised method), the green represents outputs, and the purple is the final output.
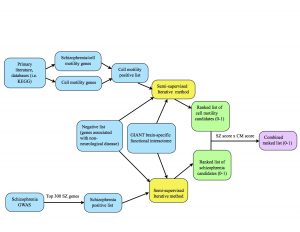
At the top of the diagram, the blue boxes go through the process of creating the positive list of cell motility genes. The genes were gathered from different signaling pathways in the KEGG database as well as studying primary literature. From these resources, I created two separate positive lists: one purely of cell motility genes and one of cell motility genes implicated in schizophrenia. I combined these together (collapsing the duplicates) in order to create a positive list of 541 cell motility genes. At the bottom of the diagram, the two blue boxes go through the process of creating the schizophrenia positive list. Alex pulled schizophrenia genes from genome-wide association studies (GWAS), then filtered the genes down to the top 300 positives by taking into account their p-values from the literature. We each ran the semi-supervised iterative method on the GIANT brain interactome with the same negative set, differing only in the positive sets we used. From there, the iterative method spit out ranked lists of schizophrenia candidates and cell motility candidates with scores ranging from 0-1 (the green boxes.) Finally, we combined the scores by multiplying them to take into account their probability of being “good” candidates for both cell motility and schizophrenia (the purple box.)
The CREU diagram can also be viewed here.
Our runtime-shortening strategies seemed to have worked well! We plotted runtime vs. iteration number and found that each iteration took about 3-4 seconds, so there’s no increase as we saw last time. However, we did find that the scores do not change after a surprisingly small number of iterations, so we will be tweaking a few things to see what changes.
Because it’s hard to tell if a semi-supervised machine learning method is actually good at what it’s supposed to accomplish, we will also be looking into ways to test our method.
Our goals for next time include:
- Run on a larger portion of the network. So far we have been using the 0.200 probability threshold network, but we will move down to 0.150 threshold.
- Change the number of positives used – see what the effect is of using 1 vs. 300+ positives on the graph.
- Plot a distribution of the ranked candidate scores.
- Plot the absolute value of the sum of changes made during each iteration.
- Look into cross validation to check if our method is doing a good job at what it’s supposed to do. This involves hiding some positives from your positive list and seeing if your method correctly identifies these hidden positives as having a high probability (if not the highest) of being involved in the pathway.
- Look into how other papers were able to be convincing about the accuracy of their method.
Next week is spring break so there will be no blog post!