
Last year, Reed re-examined its smoking policy, which touched off some fairly spirited debates around campus. The revised policy is now in place, and you can see structures around campus to provide simultaneous shelter from the rain and access to ashtrays. (Catch up on what you missed here, thanks to the Reed Quest.)
One of the interesting things about this discussion is that it centered around a key spatial theme: proximity.
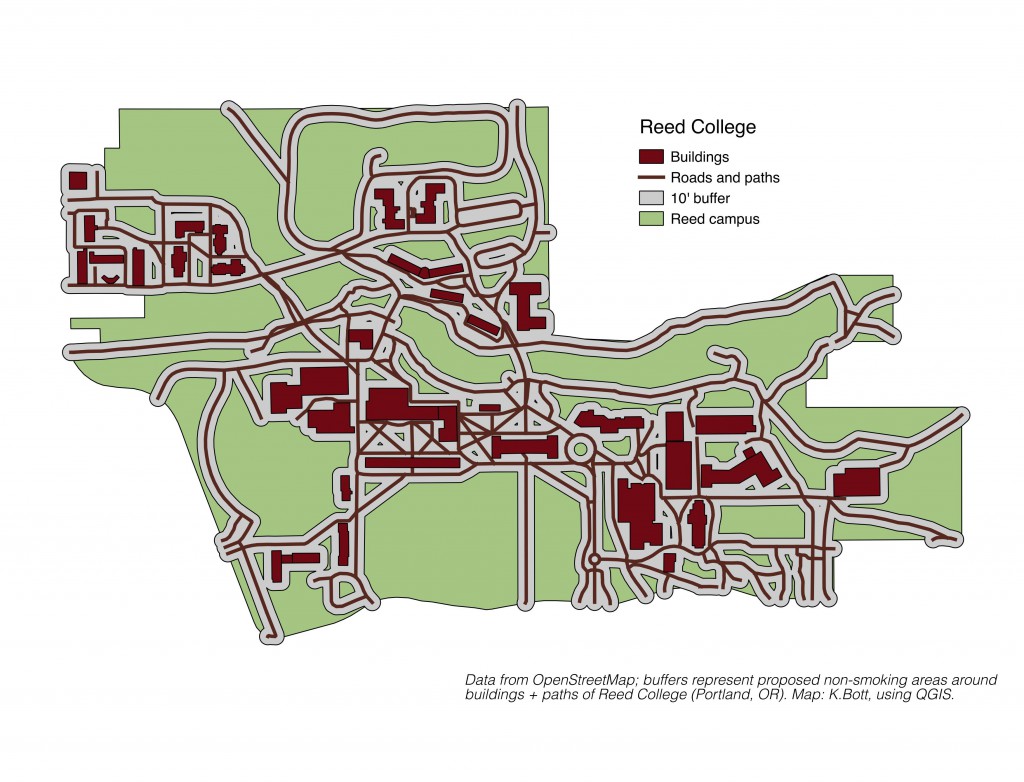
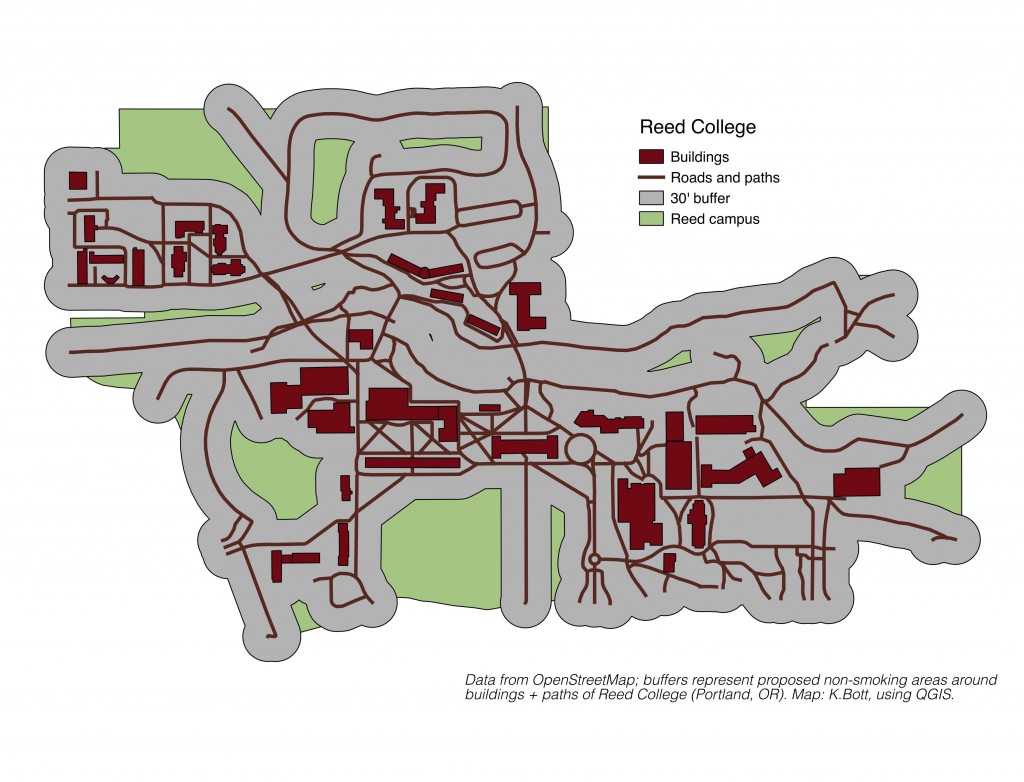
While some people proposed to ban smoking entirely, most of the issue was how far away. 10 feet (legal minimum), or 30 feet — from all entrances, exits, open windows, and air intakes.
So, questions: What does that look like? Can we map it to give the community a concrete visual as they consider policy?¹
Enter two powerful, open, and rather accessible tools: OpenStreetMap (open data) and qGIS (open source software). OSM is a community-built datasource, and dedicated geo-folk have added data from all areas of the globe. This is useful for local issues like our case study, but also invaluable in international humanitarian efforts. qGIS is an open-source GIS, used internationally for spatial analysis and mapping. As a cross-platform, free software, qGIS can be a great tool for the spatially-curious who may not have access to (or desire to use) esri’s ArcGIS platforms.
Enough background; let’s solve this problem.
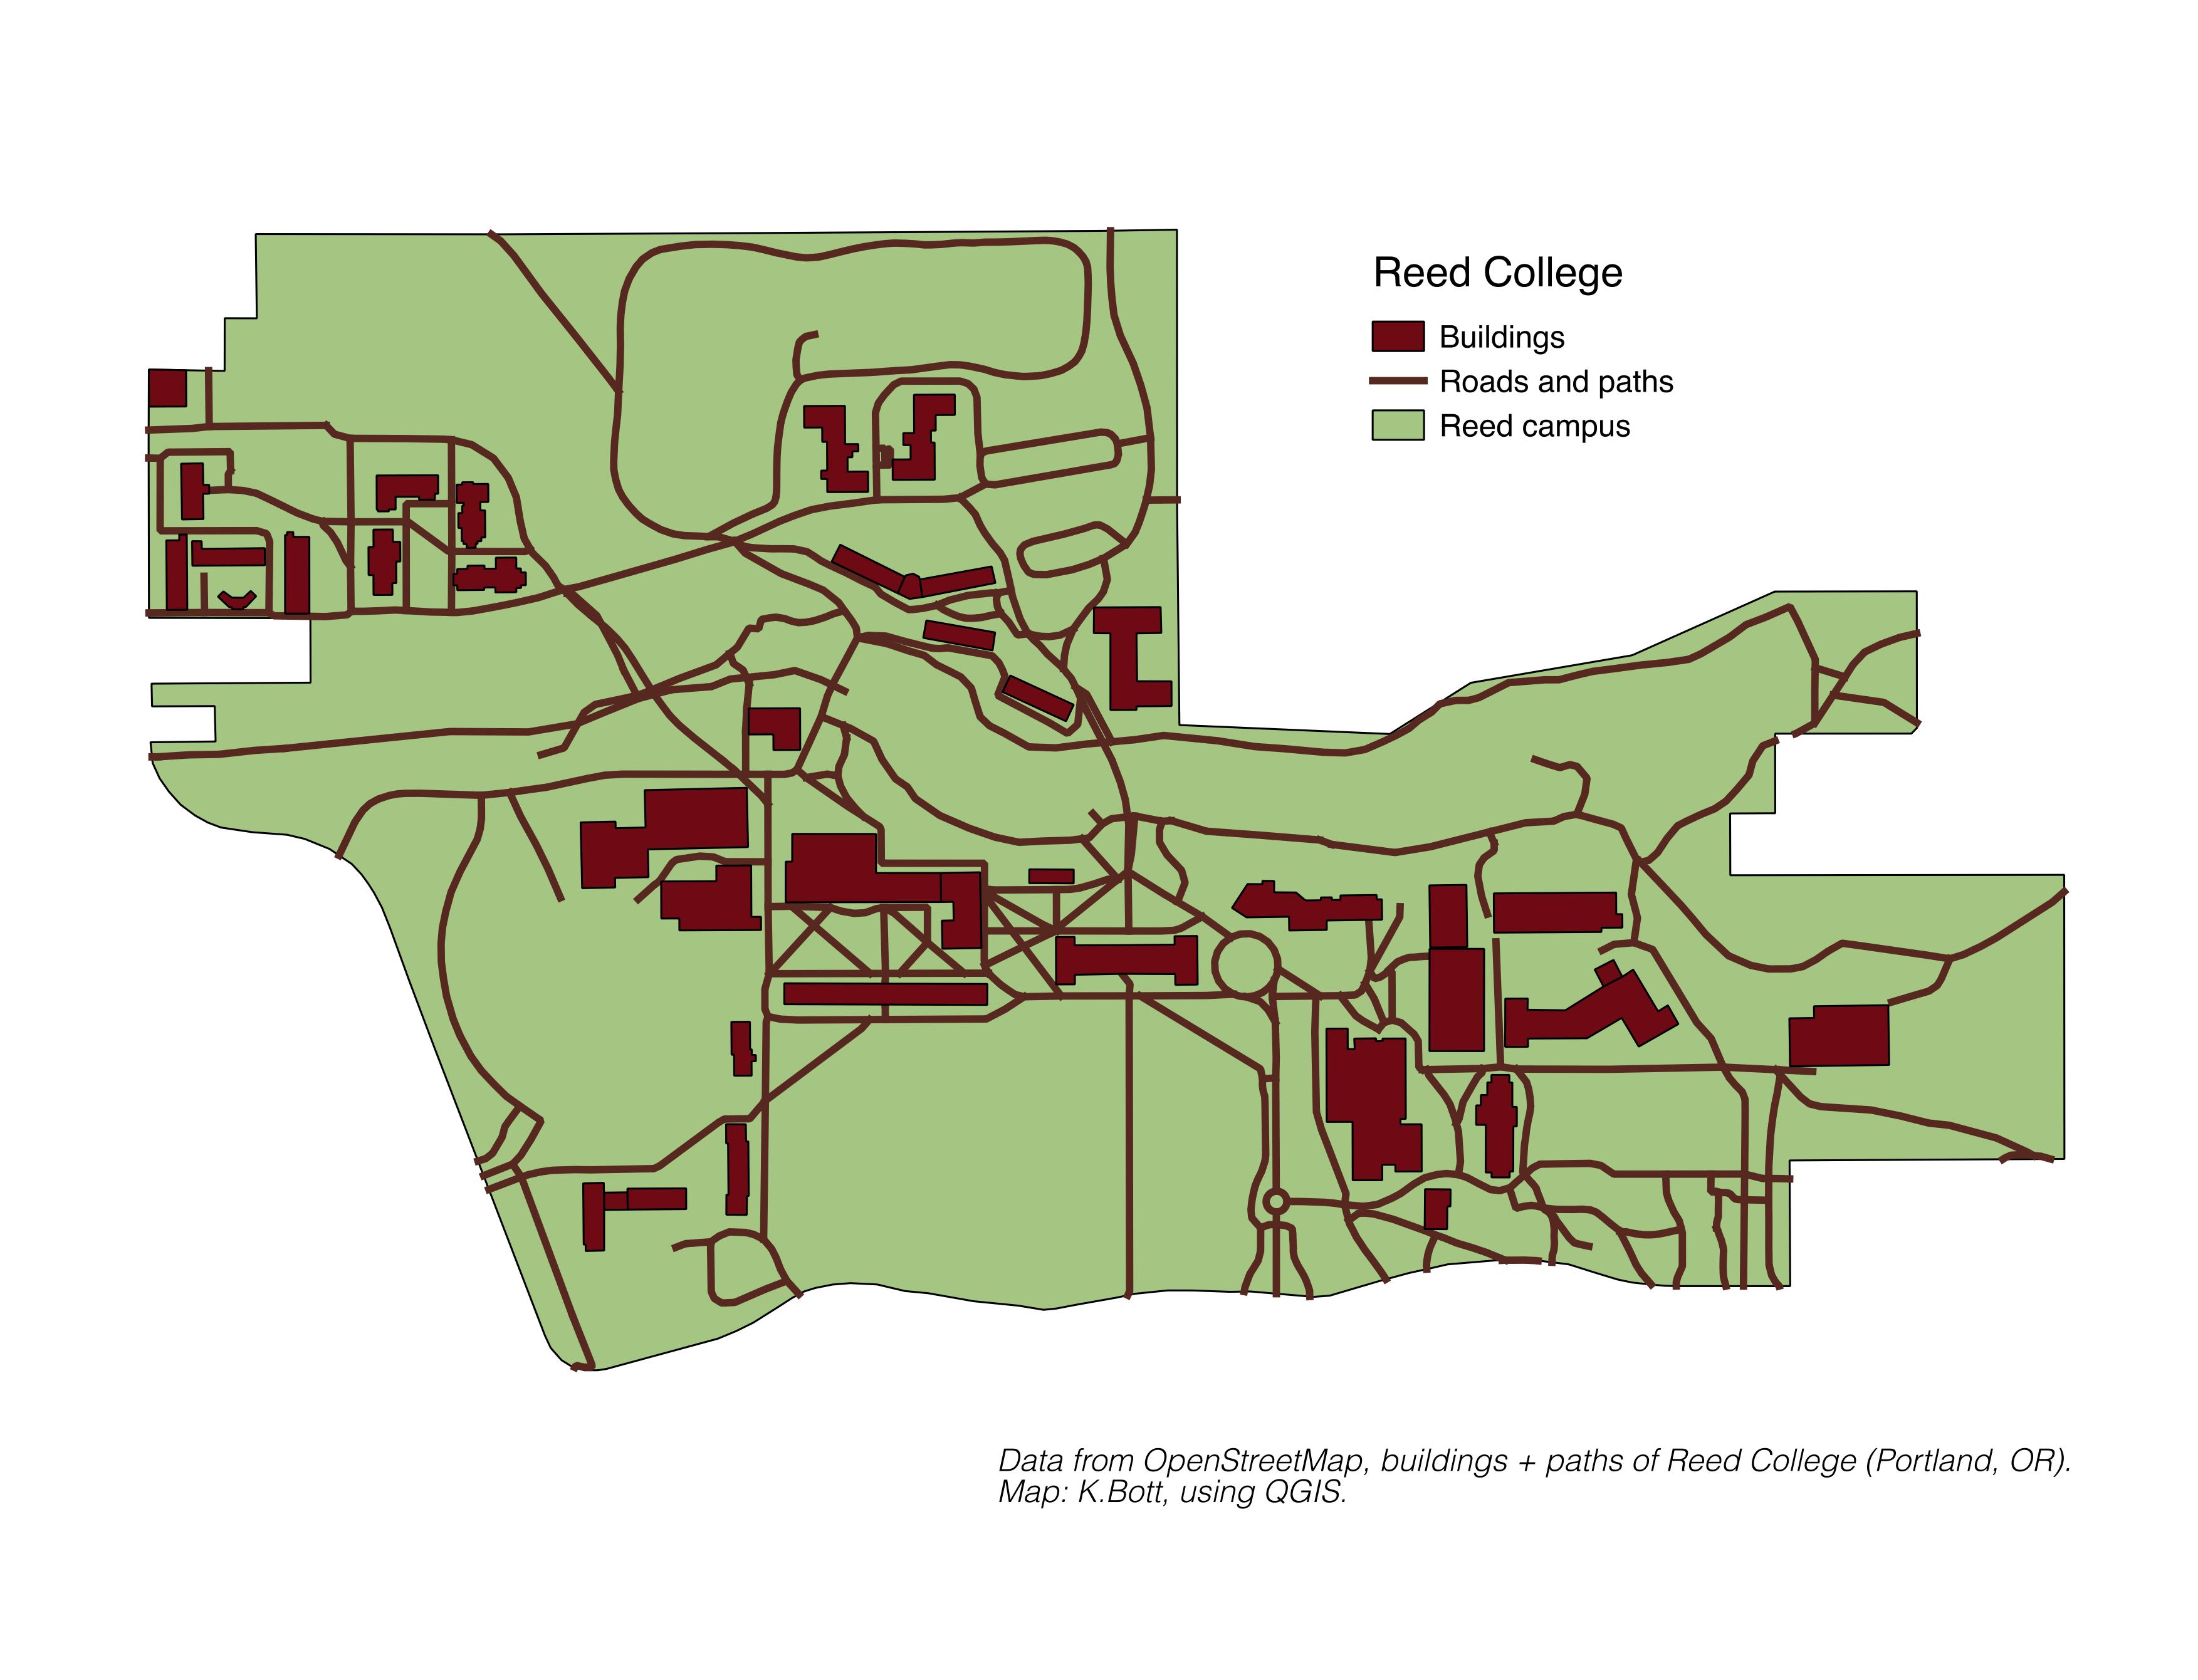
Step one: Find your data. This can be challenging, luckily (a) the Data @ Reed team is here for you and (b) so is the OSM community. Head to OpenStreetMap, and search for “Reed College.” The first result should be a collection of spatial information about Reed. Click on this, and you will jump to a map of campus. (To get data out of OSM, click “export”.)
Step two: Data import + details. Like the data version of a Julia Child cooking show, I will save you the step-by-step of importing your data/topologies. (This is not challenging, but it takes a few clicks). You have data, it’s in qGIS, and it’s properly projected².
Step three: Adventures in geoprocessing. When you brought in the Reed data, you brought in everything from the surrounding area; time to trim that down to just campus. (Not a problem, a quick “clip” to the Reed Boundary polygon³ you’ve created.) You make some design choices, add a legend, and — voila!
It’s hard to imagine what 10 feet on all sides of the buildings and paths might look like. Or 30′, for that matter. Within qGIS, we can use a geoprocessing tool to create a buffer of a chosen distance around any input feature.
A rule of no smoking within 10′ would leave the green areas as acceptable smoking areas:
A 30′ rule would leave you with these options:
Proximity (what is nearby? How close is it?) is one class of common spatial inquiry; others include questions of connectivity (how is movement possible?), clustering (what is similar?), and other patterns (detected via spatial statistics). The above is one simple example of maps proving useful in answering basic spatial questions and providing information for everyday problems.
If you’re interested in adding a spatial dimension to your project or question, definitely get in touch — there are many options for analysis and tools. (If you’d like to “just” make a map, let me know; that also counts as spatial/data fun.)
¹Quest board member Paul Messick (Political Science ’15) came to me with some variation on those questions, and made the maps you’ll find in the Smoking Issue. (Hint: the answer to “can we map it?” is generally “yes!” — ping me to talk maps anytime.)
² Projection: a topic that haunts everything spatial. Short version: the earth isn’t flat; maps and screens are flat. We have to transform data to get from the surface of the proverbial orange to the flattened peel; this involves math, and making decisions about your data and representational/analytical priorities. Easy in concept; an ongoing fight in practice.
³ Spatial data takes three forms: points, lines, and polygons. They are exactly what they sound like.