Earlier this term, I heard from students in Noelwah Netusil’s natural resources economics class. They were hoping I could help them identify how many homes are within the Johnson Creek floodplain.
This is certainly a spatial problem, so using some spatial system — in this case, a GIS* — is a good first step. Another important challenge as researcher is to translate your question into something your analytical tool can understand.
How many…
We know we are looking for a count.
…homes…
Two pieces here: (1) how do we know where the homes are? (data issue) (2) what do you mean by home? (definition issue)
…are within…
Does the entire property need to be in the floodplain? Is a small chunk of the property enough? What if just the border of the property and the floodplain overlap?
…the Johnson Creek floodplain?
How is this defined? 500-year, 100-year? Who delineated the floodplain, and what models or information did they use to identify the floodplain boundaries? These may seem like pesky details, but it is important to be specific when defining your question.
How many is simple enough, and the two parts of homes (where are they, how do we define home) are fairly easy to resolve from the Portland taxlot data available via RLIS [1]. If you look at the metadata for the taxlot dataset [2], you may note a LANDUSE field, which includes multifamily residential (MFR) and single family residential (SFR) categories; this takes care of “what is a home”.
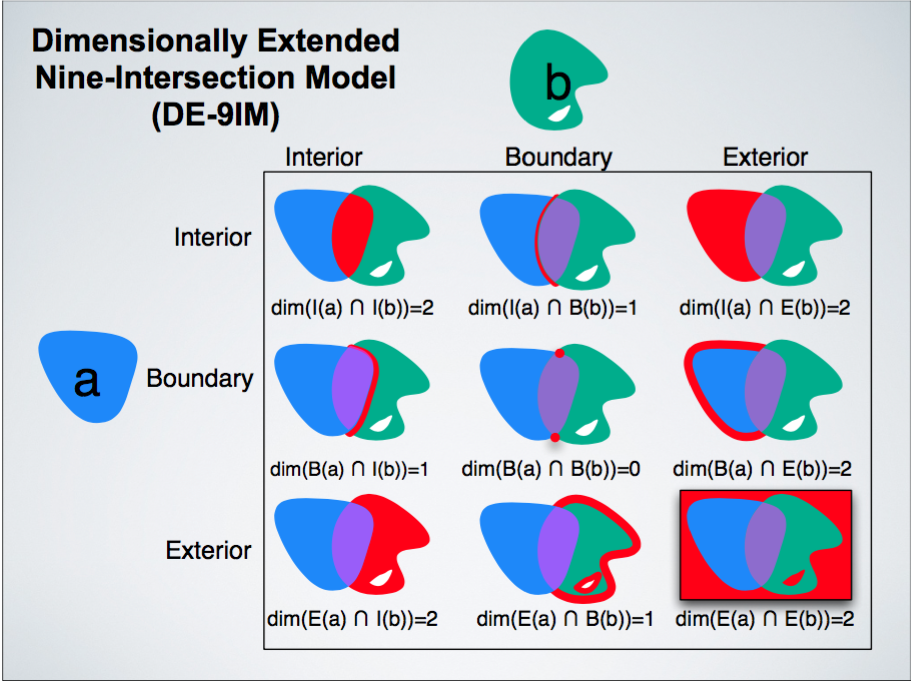
Things get a bit more complicated with within. What does that even mean? How do we know if we are within an area… or not? Welcome to the dimensionally extended nine-intersection model (DE9IM), which provides a concrete way to evaluate spatial relationships. A single point of contact provides zero dimensions of overlap, a shared line yields one dimension, and a shared area (polygon) represents two dimensions of overlap. Below you can see this represented in both set notation and graphics.
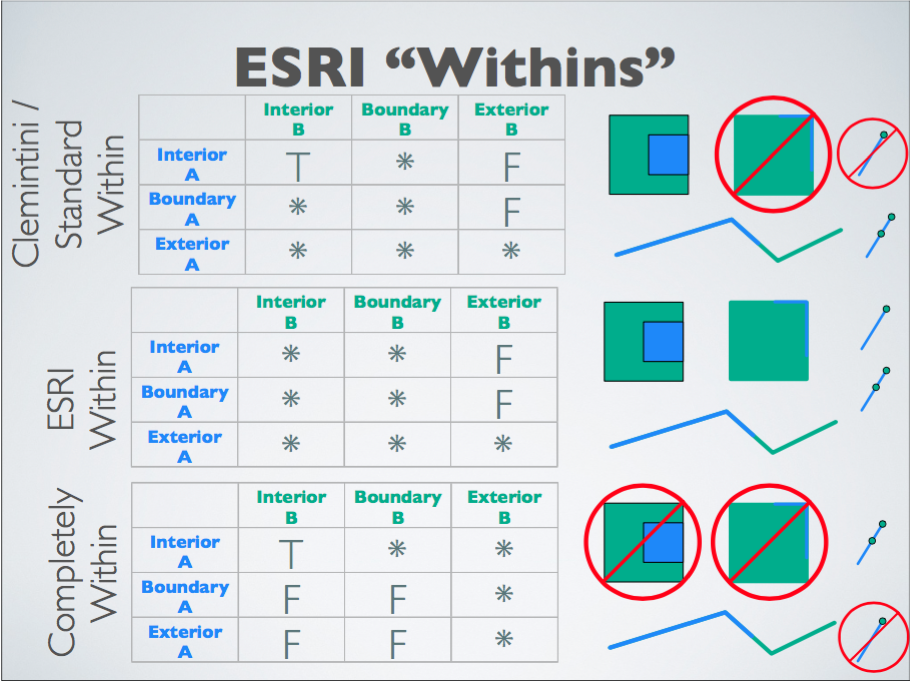
The DE9IM can help us examine some different definitions of “within” — if you are using ArcGIS/Esri software, you are given three variations on the theme of within. The words used in ArcGIS may or may not be intuitive; below is a visual that should help parse the Esri “withins”. (h/t @nizxusehen)
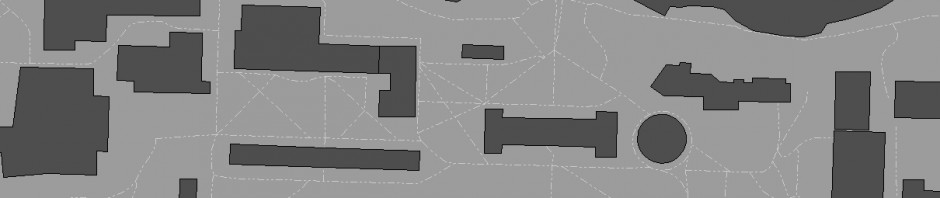
In this case, the students decided that within was not the spatial relationship they were looking for, but instead intersect. Rationale: the homes (or rather, the tax lots containing the homes) do not have to be fully contained in the floodplain; any contact with the floodplain is sufficient.
Having identified their houses of interest, the students are now ready to dive into questions about those houses and their occupants. What is the value of the potentially-affected properties (houses, land)? Who lives in these floodplain homes? How do home values and resident demographics compare to areas not in the floodplain? …
I look forward to seeing what questions the students choose to investigate, and am interested to learn what conclusions they reach by the end of the term.
If you ever want to pick apart your research question, talk maps, or dig into spatial specifics, get in touch.
*note: a spatial database would work as well, with PostGIS/postgreSQL being a house favorite
[1] http://rlisdiscovery.oregonmetro.gov/?action=viewDetail&layerID=41
[2] http://rlisdiscovery.oregonmetro.gov/metadataviewer/display.cfm?meta_layer_id=41
[3] http://twitter.com/RhoBott/status/788810834747154432