(Apologies to my commenter; I can’t get the graphics into a comment.
I appreciate the comment, and you’re right–if I collapse the categories into Independent (including leaner), Weak, and Strong Affiliators, the Independent value is significantly lower from the two values 12 of 44 times. It seems like Independents are consistently giving a lower score than all partisan groups.
But that focuses on just a small part of Killian’s argument. Her key claim is that declinin trust in government is being driven by Independents. As we saw in the previous post, for the past 40 years, trust among the three main partisan groups has moved in tandem. There is just no evidence that Independents are accounting for all or even a large part on the change. The only way you could say that is if the number of Independents was rapidly increasing, which it is not (see the end of this post)
But i did want to pursue the question. I think the main claims are that a) Independants are becoming a larger part of the electorate, and b) independents trust government less than partisans. I think both don’t stand up to scrutiny.
It gets a bit complicated, and I didn’t put some of these figures in at first because I didn’t want an overly long post.
First, I think Killian makes no attempt to distinguish between Independent “leaners” and “pure” Independents, even though scholars–and I’m sure political professionals–have long known that “leaning” can be a stronger indicator of partisan behavior than even a “weak” partisan (Bartels, 2000, “Partisanship and Voting Behavior”; Miller 1991 “Party identification, realignment, and party voting: Back to the basics”).
What happens if we pull these two apart? The pure Independents are substantially more volatile (consistent with Texeira’s understanding, not Killian’s) than all the other groups. Leaners were no different than weak partisans half the time (11 of 22 years), although almost always (except for 1968 and 2002) rated lower. Compare them to “strong” partisans and again, half the time (11 of 22, not completely overlapping!) they were no different than strong partisans. That seems like decidedly mixed evidence, though I guess it’s more of a double than a homer. Off the wall maybe? The figure plots the differences.
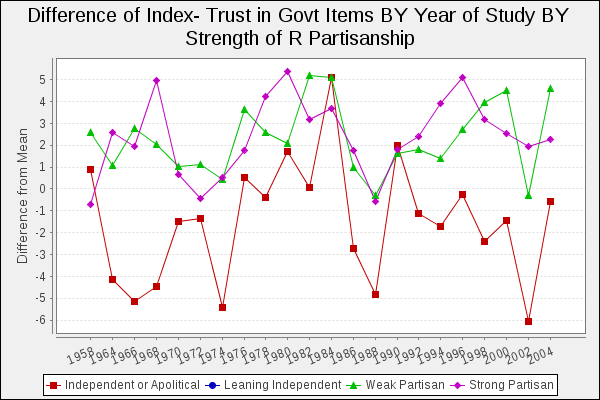
Difference in trust, Independent Leaners, Weak Partisans, and Strong Partisans compared to Pure Independents. Source: sda.berkeley.edu, using the Cumulative NES.
If you’re wondering in which years the three groups were indistinguishable, they were: ’70, ’72, ’74, ’86, ’88, ’90, and ’02. Only in 1970 and 1972, at the height of the Vietnam War and during the period when public trust was in a free fall did <em>all partisan groups</a> agree. I think there is a research project in here somewhere!
You may think I’m slicing this pie a bit too thin, but the figures in the first post make clear that partisans are more trusting when they control the Presidency. By asking me to lump together partisans, you are averaging away those effects. If trust is just about partisan attachments, as Killian suggests, and not about the policies of the party in power, wouldn’t we want to control away partisan direction while still controlling for partisan strength?
I’ve shown the plot for the Democratic side of the ledger below, this time only plotting the difference from the pure Independents. As you can see, and as Killian suggests, pure Independents generally, but not always, express lower trust in government. The leaners, on the other hand, are clearly in the partisan camp, at least insofar as trust in government is concerned.
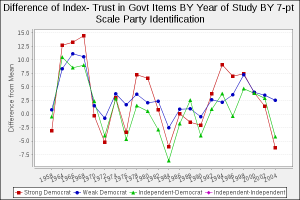
Graphic created at sda.berkeley.edu using the NES Cumulative File
To do this right, I’d need to control for both independent status, shared partisanship with the president, and party. I think I can do that, but not while my 12 year old is in the next room watching 8 Mile. I’ll just close with this–while this may just be a solid infield hit, Killian was dead wrong on her two basic assumptions: trust in government has not been systematically declining over the past 20 years, and Independent affiliation has not been increasing, except when looked at over a very limited period (since 2006).

Data from the National Election Studies website
To me, this latter is pretty devastating. You can’t stake out a claim for major reforms in the political system based on eight year’s of data, during which we fought two major wars and experienced the second worst economic downturn in a century.
One would think that triple whammy has a lot more to do with trust in government than the flat line of 10% purely Independent affiliators.