It’s no wonder sometimes political science at Reed is described as the department of good food. Here are pictures courtesy of Mariela Szwarcberg’s upper division comparative politics classes:


It’s no wonder sometimes political science at Reed is described as the department of good food. Here are pictures courtesy of Mariela Szwarcberg’s upper division comparative politics classes:
The final reading for Political Science 332 was Theda Skocpol and Vanessa Williamson’s book, The Tea Party and the Remaking of American Conservatism.
The students convinced me to have a real tea party to add some frivolity to our discussion of the book. Inspired by their interest–and by an evening on my own–I went cook crazy.
Here’s the menu:
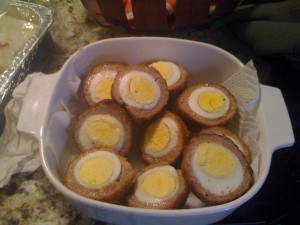
I stopped counting the eggs and heavy cream at the scotch eggs, but rolling six eggs in a pound of pork sausage and then frying them was a real experience!
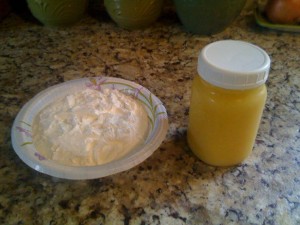
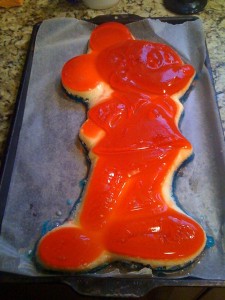
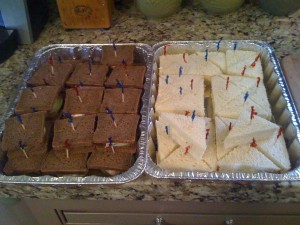
Here’s the pictures for hungry (and envious) readers!
I watched Lincoln last night in a packed Moreland Theater. A bit of two hours late, I found myself happy that our local theater was actually packed, but ambivalent about Spielberg’s biopic.
I’ll leave it to film buffs like my oldest son Matt (http://thedaytheclowncried.com/). I have a hard time viewing it in any other way than a lifetime political junkie, political scientist entering my third decade in the profession, and something of a Civil War buff.
Full disclosure: my Civil War interests have tended toward the strategy and tactics of the battlefield. The Civil War always struck me as deeply irrational from a strategic perspective. But ever since a childhood visit to the Petersburg battlefield, I’ve enjoyed non-fiction about the War.
But upon reflection, little about Lincoln directly. I’ve read Safire’s novel Freedom and Jay Winik’s book about the end of the war. I’ve tried to dig my way through Carl Sandburg’s biography without success. For someone with about two dozen presidential biographies under his belt, this is a bit embarrassing. More embarrassing still, perhaps: I’ve read Doris Kearns’s biography of LBJ but Team of Rivals, the book that the movie is supposedly based on, sits on my shelf unread.
That’s a long lead in for a review, but it’s hard to watch a biography of Lincoln without understanding what you bring to the table.
The short review: I enjoyed the movie a lot. I loved the scenes of congressional wheeling and dealing, probably the best scenes of Congress ever (though perhaps Greg Koger cantell me why they did not vote on the motion to table, and at another point, they seconded the motion to vote on the 13th Amendment but did not continue debate).
The Lincoln scenes, however, alternated between moments of wonder and moments of discomfort. Daniel Day-Lewis is astounding as Lincoln, and the makeup work on him later in the movie is amazing. He seemed completely immersed in the role. That was wonderful.
What was discomforting, however, was the hagiography. Did Lincoln really disarm friend and foe with folksy tales that carried essential kernels of wisdom and insight? Did he really stop and chat with every manner of citizen he met, inevitably sharing a ribald joke or self-effacing story? Other than scenes with the Cabinet, virtually every interaction they showed with Lincoln had the participants in awe of the man.
Is this based on any historical record, or is this Kearns-Goodwin the populist historian and television personality? (Here’s Kearns-Goodwin’s reaction to the movie, not surprisingly over the top enthusiastic.)
But the non-analytical side of my brain kept asking: how else can you portray the most revered president in American history–the greatest leader, the most effective speaker, and the most historically important? Is he the American civic Christ figure? (That’s certainly how he is portrayed at times in the movie.)
David Brooks liked the movie for its politics. So did I. David and I attended University of Chicago at the same time. He’s blandly conservative, I’m blandly liberal. I’m not sure a movie that he and I like has much of a chance of wide success. But I’m pretty sure all my political science friends will love it!
Poll Closing Times (EST) (Battlegrounds in bold):
Absolutely the best guide to key counties: http://dsl.richmond.edu/voting/interactive/. You can set this to compare the 1996, 2000, and 2004 results to identify key counties for Obama and Romney in Virginia. If 2008 were included, this would be the best guide of all.
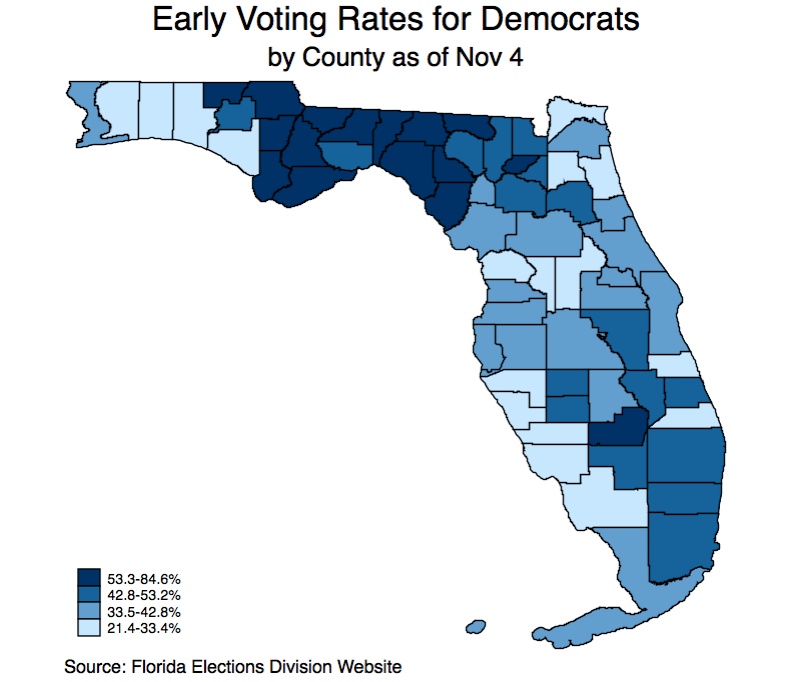
Early in person voting by Democrats in Florida, courtesy of Jacob Canter, Reed junior.
(Crossposted from Earlyvoting.net)
Just got this email:
Dear Prof. Gronke,
I, and my colleagues, have been unable to satisfactorily answer this question, “If by law voting shall be held on the “first Tuesday after the first Monday in November” how is it that we have ‘early voting?'” My state of Michigan does not have early voting so I/we don’t have any first hand experience with this practice. I first posed this question to Dr. Michael McDonald and he replied that early voting is legal as the result of a Supreme Court case involving the state of Oregon, but he was unable to recall the name of the case. As an expert in these matters, I was hoping that you might be able to provide the name of the case so that I can do further research and be better able to supply an informed answer.
Thank you in advance,
Here is my response. This probably should be part of another FAQ. Continue reading
Courtesy of thenandnow.com
There has been a lot of chatter about the meaning of Nate Silver’s current election forecast.
Unfortunately, what the commentary reveals is less about Silver and more about statistical illiteracy. Silver’s model is complex, but the basic logic is quite simple: he runs a forecasting model based on a lot of state public opinion polls, then creates thousands and thousands of random “draws” from the predictions of that model.
Currently, approximately 3/4 of those random draws have Obama winning the electoral college. Sounds good if you are a Democrat but keep in mind:
Andrew Gelman, a political statistician at Columbia, provides an apt metaphor. In football, if your team is leading by 2 points with less than 5 minutes to go, your team will win 65% of the time.
Does this mean you feel confident with a 2 point lead with 5 minutes left? What if John Elway is the quarterback for the other team? Maybe you don’t think Mitt Romney has a John Elway drive in his campaign, but look at his standing just a few weeks ago, and look at it now.
 A hat tip for today’s posting goes to Charles Stewart of MIT, whose “Political Science Laboratory” course inspired me to engage my introductory statistics students in data management using real data sources.
Regular readers of this blog may have seen graphics plotting the daily ballot returns from North Carolina. The graphics are identical to the kind of ballot chasing engaged in by the presidential campaigns, and really any campaign in a state with substantial early voting.
The ballot return information is a public record, and theoretically, any citizen, organization, or campaign should have equal access. Unfortunately, things aren’t so simple. As Michael McDonald reports:
Election officials may not report early voting statistics. I attempt to collect as much of the information about these ballots as possible. However, I do not hound election officials for these statistics because they are busy doing the important work of preparing for the upcoming election. Sometimes data will be available only at the local level. I cannot continuously scan for local data, so I appreciate tips on where to find data.
I wish every state made these data available for a free electronic download. If your state does not, I urge you to contact your state legislator and see why not.
But suppose you do have these data: what do you do with them?
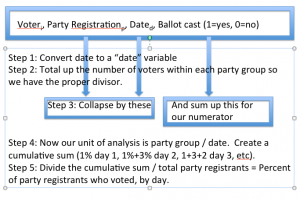
It turns out that it’s not very hard to go from individual level vote reports to turnout information, if you have the right toolbox. The tool you need is a statistical program capable of reading in datafiles that have hundreds of thousands of cases. That’s too many for Excel. The most commonly used packages in political science are Stata (the example shown below) and R. (The big advantage of R is that it is publicly available, but I’m not conversant yet with the software. My hopes are that some entrepreneurial reader of this blog will translate the Stata code into R code.)
With the tools in hand, the steps involved can seem confusing, but if you follow the attached presentation, I think not too difficult. In brief:
Obviously, it’s a bit more complicated than that, but I hope this powerpoint presentation (PDF format) that I prepared for my class can guide anyone through the process. The Stata do file referenced in the Power Point can be downloaded as well.
(This post is co-authored with Jacob Canter, Reed sophomore and EVIC research assistant and is crossposted from earlyvoting.net)
The early ballots are beginning to pile up in North Carolina, and we can finally start to discern some patterns of turnout by partisanship and by race.
As Michael McDonald has pointed out on Friday, it’s important in this state (as in many states) to carefully discriminate between ballots requested and returned by mail–no excuse absentee ballots–and ballots that are cast in person at an early voting location. What makes the NC situation a bit confusing for any new to early voting is that the state describes both modes of balloting as “absentee” voting; the early in-person variant is called “one-stop absentee voting” because the absentee ballot is requested “in-person.” Turnout reports are merged into a single file; the critical field in this file is “Ballot Request Type” which contains entries for “Mail”, “In Person”, “Overseas”, and “Military.”
The first graphic reports the number of ballots returned (and in the case of by mail ballots, accepted) as a proportion of all registered voters, by party. The interesting pattern to notice here is the sudden increase in Democratic turnout on the 20th-18th days before the election. This corresponds to the start of early in-person voting.
The underlying data show that Republicans use by-mail voting at a much higher rate in the state than do Democrats (the first graphic of raw returns is useful in NC only because the proportions of party registrants is roughly comparable–I need to have Jacob reproduce these as proportions of party registrants later this week).


The second graphic shows that of the ballots requested there is only a slight difference in the rate of return by party. This is what McDonald refers to as the lack of substantially higher Republican enthusiasm in the state at this point.
Finally, the in-person rates by race illustrate both the stronger preference for this method among African Americans in the state, and of course, help account for a large portion of the party pattern observed above. In my opinion, it’s a bit early to conclude much about Democratic mobilization efforts until we have another few days of data. We’ll work on comparing these trend lines to 2008 in a few days.

Why focus on the groups who voted for Obama? Why not on the groups that didn’t?
Image Courtesy of the NY Times
There have been a flurry of analyses in recent days about the surprising level of support Obama garnered from various groups in the population. If we were to read the commentary, at least four different subgroups of the population were critical to the Obama victory.
There certainly is a pattern to the 2012 results, and the pattern is this: Obama won nearly every group not defined as “older, white, male.”
The question, then, is whether it really helps us to even talk about these groups individually. Obama’s support coalition was broad and deep. It encompassed almost every segment of the the population. I’m less certain that this is a story about Blacks, or Latinos, or Asian Americans, or Gays, or Women then it is a story about a Republican Party appealing to an increasingly small segment of the voting population.
And while I’m not surprised to see advocates claim victory–and expect rewards–for their group (and these are not claims made by my colleagues above), I would not be surprised if these groups are ultimately disappointed, since just about everyone can claim credit for his win.