In a first course in calculus, many students encounter an image similar to the following:
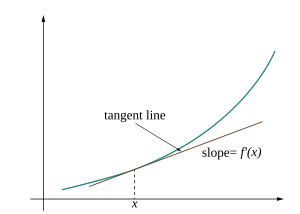
Such an illustration highlights a key property of the single variable derivative: it’s the best linear approximation of a function at a point. For functions of more than one variable, the derivative exhibits this same characteristic, yet there is no obvious corresponding picture. What would an analogous visualization look like for a multivariable function?
For the past few weeks, I’ve been working towards a visualization of multivariable functions and their derivatives. Check out the end result here, or read on to hear about my process. I assume some knowledge of calculus and mathematical notation.
Continue reading “Visualizing multivariable functions and their derivative”