
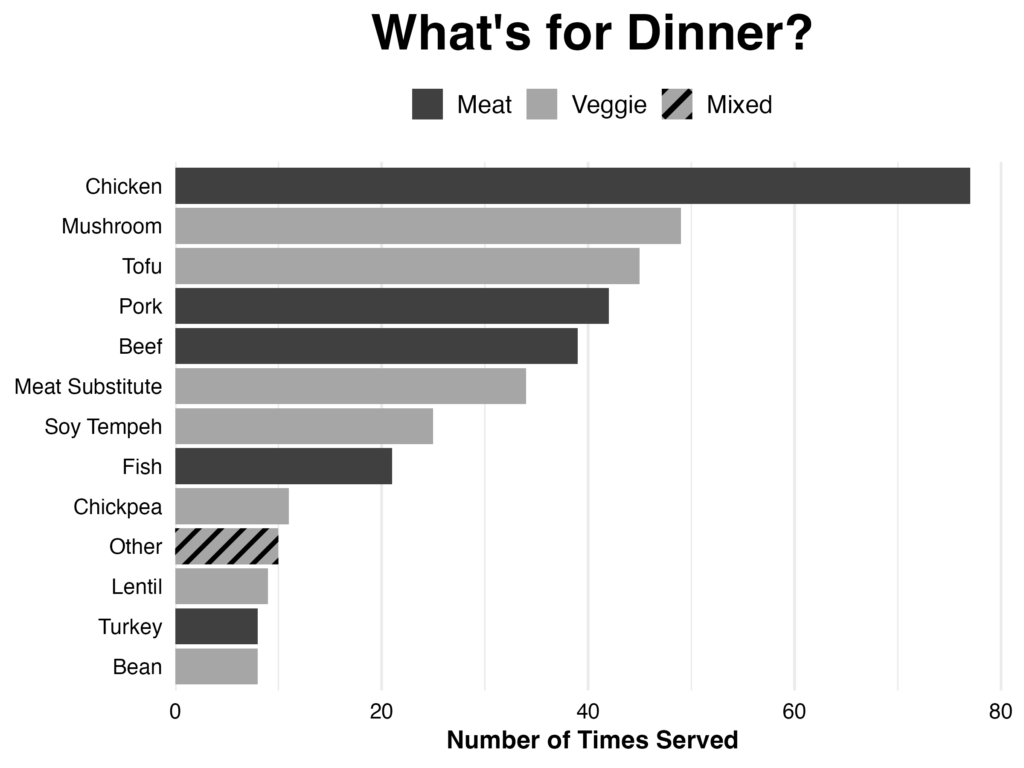
This week we wanted to know what types of meals were being served at commons. We found out that a ton of data on that is available and the chart in the Quest just skims the surface. If you want to learn more about the data, or use it yourself, keep reading for a walk-through or email data@reed.edu.
Where did we find the data?
Every day Bon Appetit’s menu is posted on the Commons homepage. Since we wanted to get access to past menus, the first thing to do was see if that information was cached somewhere. When you go to any Commons’ menu that is not todays, you will see the URL look something like this: https://reed.cafebonappetit.com/cafe/commons-cafe/2026-09-11/ The important thing there is that it ends in the specific date. That means each menu was theoretically stored as its own page that we could access using a web-scraping script.
How did we web scrape the data?
The individual URL dates indicate that each day’s data exists as an inline JS object in the page’s HTML code. So we can write a script to access that and pull out the code. I prefer working in R, so I wrote this script in R. But it could have been written in Python or a number of other languages.
There is actually a lot of data contained in each day’s page. To make the graph simpler (because it has to print in black and white and be legible when small), I decided to only pull dinner menus and only from the SimplyOasis and Classics stations. But more data than this is available if you want to use it!
Here’s the script. The main things it relies on are the packages {httr} and {jsonlite}. {httr} handles the HTTP request — downloading each day’s page — while {jsonlite} takes the JSON-formatted menu data embedded in that page and turns it into something R can actually work with.
Show the script
# load libraries
library(httr)
library(jsonlite)
library(stringr)
library(readr)

####  set selections for scraping
###############################

# get url for menu
cafe_url <- "https://reed.cafebonappetit.com/cafe/commons-cafe/%s/"

# select what meal (can be single value or vector)
daypart <- "Dinner"
# select station (can be single value or vector)
station_wanted <- c("SimplyOASIS", "Classics")
# select date range
dates <- seq(as.Date("2026-01-26"), as.Date("2026-05-14"), by = "day")


####  create functions to:
####  fetch webpage,
####  extract the menu,
####  extract the correct part of day

# downloads one date's menu page as raw HTML
fetch_page <- function(d) {
  url <- sprintf(cafe_url, format(d, "%Y-%m-%d"))
  resp <- GET(url, timeout(30))
  stop_for_status(resp)
  content(resp, as = "text", encoding = "UTF-8")
}

# pulls the menu_items from the JavaScript and parses it as JSON
extract_menu_items <- function(html) {
  pattern <- regex("Bamco\\.menu_items\\s*=\\s*(\\{.*?\\});", dotall = TRUE)
  match <- str_match(html, pattern)
  fromJSON(match[1, 2], simplifyVector = FALSE)
}

# pulls the relevant daypart and returns as a named list
extract_dayparts <- function(html) {
  pattern <- regex(
    "Bamco\\.dayparts\\['(\\d+)'\\]\\s*=\\s*(\\{.*?\\});\\s*\\n\\s*\\}\\)\\(\\);",
    dotall = TRUE
  )
  matches <- str_match_all(html, pattern)[[1]]
  dayparts <- list()
  for (i in seq_len(nrow(matches))) {
    dayparts[[matches[i, 2]]] <- fromJSON(matches[i, 3], simplifyVector = FALSE)
  }
  dayparts
}


####  create function extract the actual meals
###############################

# helper function for pulling menu
# if a is NULL, return b; otherwise return a
# (can't get combinable rows if NULL values are present)
`%||%` <- function(a, b) if (is.null(a)) b else a

# extracts meals based on previous parameters
get_meal_items <- function(d) {
  html <- fetch_page(d)
  menu_items <- extract_menu_items(html)
  dayparts <- extract_dayparts(html)

  # create empty list for output
  rows <- list()
  for (dp in dayparts) {
    # only do this for the correct meal time
    if (!(dp$label %in% daypart)) next

    # find every station that matches the station(s)_wanted
    # using Filter because it's lists not dataframes
    stations <- Filter(\(s) str_trim(str_remove_all(s$label, "<[^>]+>")) %in% station_wanted, dp$stations)

    # make sure there's something there to find
    if (length(stations) == 0) next

    # for every matching station, grab data for each of its items
    for (station in stations) {
      for (item_id in station$items) {
        # get the item's full list of things
        item <- menu_items[[item_id]]
        # make a dataframe out of the following
        rows[[length(rows) + 1]] <- data.frame(
          date = as.character(d),
          meal = dp$label,
          item_name = item$label,
          description = item$description %||% "", # put "" instead of NULL
          price = as.character(item$price %||% ""), # put "" instead of NULL
          dietary_tags = paste(unlist(item$cor_icon), collapse = ", ")
        )
      }
    }
  }
  # bind everything together
  do.call(rbind, rows)
}


####  actually pull the data
###############################

# create empty list for things to go in
rows <- list()
# get meal for each date
for (i in seq_along(dates)) {
  d <- dates[i]
  rows[[i]] <- get_meal_items(d) # this is the line that actually runs everything

  # prints each date just to show progress
  cat(as.character(d), "\n")
  # small pause between requests (technically don't need if it's too slow)
  Sys.sleep(0.1)
}

all_meals <- do.call(rbind, rows)


####  write file
###############################

write_csv(all_meals, "data/dinner_jan26_may14.csv")

</details>
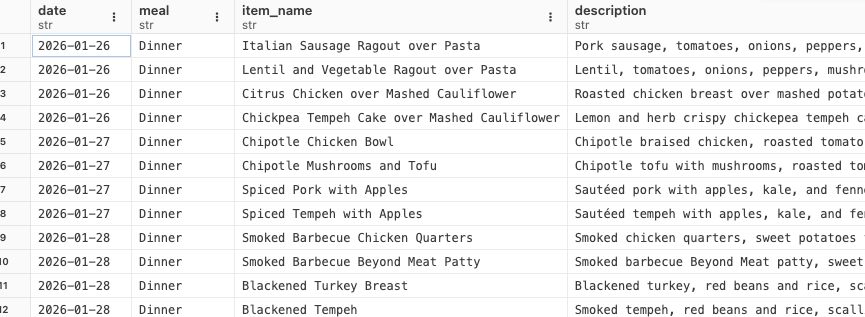
Out of this script, I get a csv file that looks like this:
Wrangling the data and graphing
The way I designed the scraping leaves the data pretty clean, so not a lot needs to be done to work with it. The only thing I need to do is decide what things I want to pull from it. After looking through it, I decided that the best thing would be to look at main ingredients from the item name. I decided to focus on proteins (and mushrooms). Full disclosure, I used Claude to generate this list. I have strong and mixed feelings about AI, but this is one of the uses where it excels and it was much faster than trying to just identify things by most common word because things like “pasta” or “seasoned” came up a lot.
- Meat Substitute: Beyond, Gardein, Chik, Impossible
- Chicken: Chicken, Pollo
- Beef: Beef, Steak, Brisket, Tri-Tip
- Pork: Pork, Sausage, Bratwurst
- Turkey: Turkey
- Fish: Fish, Salmon
- Tofu: Tofu
- Mushroom: Mushroom, Portobello
- Chickpea: Chickpea, Garbanzo
- Soy Tempeh: Tempeh (tempeh not described as chickpea or lentil)
- Lentil: Lentil
- Bean: Bean
I organized the data so that each dish had a column classifying it as the above or “other”. Then the script just counted up the frequency of each. I also classified as “meat”, “veggie”, or “mixed” (because other contained meat and veggie dishes).
Then I made a bar graph with flipped coordinates so the foods would be on the y-axis. When you have a lot of bars to show or things with long names, this is a good thing to do. People can see the difference in bars just as easily, and it makes reading the names simpler. So, consider doing this with your bar graphs.
I colored the bars by meat/veggie/other. I made other striped and to do this I needed to add a bit of more specialized code with the package {ggpattern}. Then I made adjustments to the axis labels, the theme background, and the display of the gridlines.
Show the script
# load library
library(tidyverse)
library(ggpattern)

# load data
raw_menu <- read_csv("data/dinner_jan26_may14.csv")

# most popular single meal
most_popular <- raw_menu |>
  group_by(item_name) |>
  summarize(total = n()) |>
  arrange(desc(total)) |>
  slice(1) |>
  pull(item_name)

# search item_name to tag main ingredient
# group into categories
# order is hierarchical (helps with sausage vs fake sausage, diff kinds of tempeh)
menu <- raw_menu %>%
  mutate(main_ingredient = case_when(
    str_detect(item_name, regex("Beyond|Gardein|Chik|Impossible", ignore_case = TRUE)) ~ "Meat Substitute",
    str_detect(item_name, regex("Chicken|Pollo", ignore_case = TRUE)) ~ "Chicken",
    str_detect(item_name, regex("Beef|Steak|Brisket|Tri-Tip", ignore_case = TRUE)) ~ "Beef",
    str_detect(item_name, regex("Pork|Sausage|Bratwurst", ignore_case = TRUE)) ~ "Pork",
    str_detect(item_name, regex("Turkey", ignore_case = TRUE)) ~ "Turkey",
    str_detect(item_name, regex("Fish|Salmon", ignore_case = TRUE)) ~ "Fish",
    str_detect(item_name, regex("Tofu", ignore_case = TRUE)) ~ "Tofu",
    str_detect(item_name, regex("Mushroom|Portobello", ignore_case = TRUE)) ~ "Mushroom",
    str_detect(item_name, regex("Tempeh", ignore_case = TRUE)) &
      str_detect(item_name, regex("Chickpea|Garbanzo", ignore_case = TRUE)) ~ "Chickpea",
    str_detect(item_name, regex("Tempeh", ignore_case = TRUE)) &
      !str_detect(item_name, regex("Lentil", ignore_case = TRUE))~ "Soy Tempeh",
    str_detect(item_name, regex("Chickpea|Garbanzo", ignore_case = TRUE)) ~ "Chickpea",
    str_detect(item_name, regex("Lentil", ignore_case = TRUE)) ~ "Lentil",
    str_detect(item_name, regex("Bean", ignore_case = TRUE)) ~ "Bean",
    # real dishes with other main ingredient
    item_name %in% c(
      "Garlic Roasted Lamb",
      "Stuffed Peppers with Smashed Potatoes",
      "Eggplant Stew over Polenta",
      "Seared Yams over Polenta",
      "Vegetable Pozole",
      "Pozole Chile Verde"
    ) ~ "Other",
    TRUE ~ NA_character_
  )) %>%
  # drop things like ice cream desserts that aren't dinner
  filter(!is.na(main_ingredient))

# summarize and arrange by count
summary_menu <- menu |>
  group_by(main_ingredient) |>
  summarize(count = n()) |>
  arrange(desc(count))
summary_menu


# add meat vs veggie
# other has lamb, so it's a combo of both
food_type <- c(
  "Chicken" = "Meat",
  "Beef" = "Meat",
  "Pork" = "Meat",
  "Turkey" = "Meat",
  "Fish" = "Meat",
  "Mushroom" = "Veggie",
  "Tofu" = "Veggie",
  "Meat Substitute" = "Veggie",
  "Soy Tempeh" = "Veggie",
  "Chickpea" = "Veggie",
  "Lentil" = "Veggie",
  "Bean" = "Veggie",
  "Other" = "Mixed"
)

summary_menu <- summary_menu |>
  mutate(food = food_type[main_ingredient],
         food_pattern = case_when(food == "Mixed" ~ "Y",
                                  TRUE ~ "N"))

# horizontal bar plot
ingredient_plot <- summary_menu |>
  ggplot(aes(x = reorder(main_ingredient, count), y = count, fill = food, pattern = food_pattern)) +
  geom_col_pattern(
    color = NA,
    pattern_fill = "black",
    pattern_color = NA,
    pattern_density = 0.3,
    pattern_spacing = 0.03,
    pattern_angle = 45
  ) +
  coord_flip() +
  scale_y_continuous(expand = expansion(mult = c(0, 0.05))) +
  scale_fill_manual(
    values = c("Meat" = "gray25", "Veggie" = "gray65", "Mixed" = "gray65"),
    breaks = c("Meat", "Veggie", "Mixed"),
    name = NULL
  ) +
  scale_pattern_manual(values = c("N" = "none", "Y" = "stripe")) +
  guides(
    pattern = "none",
    # this forces only "Both" to look striped
    fill = guide_legend(override.aes = list(pattern = c("none", "none", "stripe")))
  ) +
  labs(
    x = NULL, y = "Number of Times Served",
    title = "What's for Dinner?") +
  theme_minimal(base_size = 16) +
  theme(
    plot.title = element_text(face = "bold", size = 28, hjust = 0.5),
    plot.subtitle = element_text(size = 13, color = "black", margin = margin(b = 10), hjust = 0.5),
    axis.text.x = element_text(color = "black", size = 12),
    axis.text.y = element_text(color = "black", size = 12, margin = margin(r = 0)),
    axis.title.x = element_text(face = "bold", size = 14),
    legend.text = element_text(size = 14),
    legend.position = "top",
    panel.grid.minor.y = element_blank(),
    panel.grid.major.y = element_blank()
  )

ingredient_plot

# save image and a vector copy for print
ggsave("ingredient_plot.png", ingredient_plot, width = 8, height = 6)
ggsave("ingredient_plot.svg", ingredient_plot, width = 8, height = 6)
Things you could do with these scripts
So there’s a lot more to the data than just what I got. I only looked at last semester, but the data goes back to 2014 (I think, you’d have to double check). The JSON data has meals from all times of day and all stations present in commons. It also has prices and dietary tags, like gluten free. Here are a few ideas:
- Does the menu change when there are holidays approaching? More pie at Thanksgiving or more halal food during Ramadan?
- How many new dishes are added each semester or is the menu consistent over time?
- How do the Farm to Fork offerings change with seasons?
- Was there any shift after Covid?