 A hat tip for today’s posting goes to Charles Stewart of MIT, whose “Political Science Laboratory” course inspired me to engage my introductory statistics students in data management using real data sources.
Regular readers of this blog may have seen graphics plotting the daily ballot returns from North Carolina. The graphics are identical to the kind of ballot chasing engaged in by the presidential campaigns, and really any campaign in a state with substantial early voting.
The ballot return information is a public record, and theoretically, any citizen, organization, or campaign should have equal access. Unfortunately, things aren’t so simple. As Michael McDonald reports:
Election officials may not report early voting statistics. I attempt to collect as much of the information about these ballots as possible. However, I do not hound election officials for these statistics because they are busy doing the important work of preparing for the upcoming election. Sometimes data will be available only at the local level. I cannot continuously scan for local data, so I appreciate tips on where to find data.
I wish every state made these data available for a free electronic download. If your state does not, I urge you to contact your state legislator and see why not.
But suppose you do have these data: what do you do with them?
It turns out that it’s not very hard to go from individual level vote reports to turnout information, if you have the right toolbox. The tool you need is a statistical program capable of reading in datafiles that have hundreds of thousands of cases. That’s too many for Excel. The most commonly used packages in political science are Stata (the example shown below) and R. (The big advantage of R is that it is publicly available, but I’m not conversant yet with the software. My hopes are that some entrepreneurial reader of this blog will translate the Stata code into R code.)
With the tools in hand, the steps involved can seem confusing, but if you follow the attached presentation, I think not too difficult. In brief:
- You start with individual voter records that include the name, age, party, date that the absentee ballot was requested, date that the absentee ballot was returned, and the status of the absentee ballot. (We’re want to know if the ballot was “accepted” or not.) The data file is freely downloadable at ftp://www.app.sboe.state.nc.us/enrs/absentee11xx06xx2012.zip
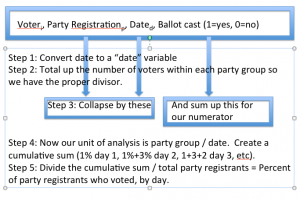
The file looks something like thisVOTER CODE JOHN SMITH 123 MAIN ST RALEIGH NC … DEM … 10/1/2012 10/15/2012 BY MAIL ACCEPT - You need to convert the date variables, which look to statistical programs like a string of characters (e.g. 10/10/2012) to a “date” variable.
- We count up how many partisan requests there were for absentee ballots.
- You need to code the ballot as accepted (voted = 1) or not (voted =0).
- Now things get tricky. We “collapse” the data so that our smaller data file is organized by date and by party. The file will end up looking like this:DATE DEMS REPS UNA DEMVOTED REPVOTED UNAVOTED
10/15/2012 10,219 9221 8217 123 . .
10/15/2012 10,219 9221 8217 . 347 .
10/15/2012 10,219 9221 8217 . . 456This made up file shows that on Oct. 15, 123 Democratic ballots were returned, 347 Republican ballots, and 456 Unaffiliated ballots. - With this file in hand, we “cumulate” the number of returned ballots, divide by the number in each party, and voila! We have the percentage of partisan ballots returned by day.
Obviously, it’s a bit more complicated than that, but I hope this powerpoint presentation (PDF format) that I prepared for my class can guide anyone through the process. The Stata do file referenced in the Power Point can be downloaded as well.