Seventy-eight Reed College students have made a forecast of the outcome of the 2018 midterm congressional elections, and their forecast is for a Democratic takeover of the House, with an average predicted seat change of -30 for the GOP.
Reed College students taking Political Science 260: American Politics and Policy with Professors Paul Gronke and Chris Koski have been working for the past week on a “fundamentals” forecasting model of the 2018 midterms, drawing on insights from articles in PS: Political Science and Politics and a wonderful Twitter thread about “silly” variables.
Kudos to G. Elliott Morris, Brad Spahn, Derek Willis, and Deborah Sharon for participating in the thread and helping to get our students excited about the project!
Now to the forecasts! The students estimated a model based on two variables, presidential approval (collected from “a credible source”, ha ha evil professor, what constitutes “credible” you ask), a measure of the economy, and one “silly variable”.
Student estimate the GOP seat loss to be between 30 and 40 seats, but there are a few, shall we say, outliers? I expect that the 170 seat loss is an overly optimistic Democrat, along with those students how predicted a 30-40 seat gain. 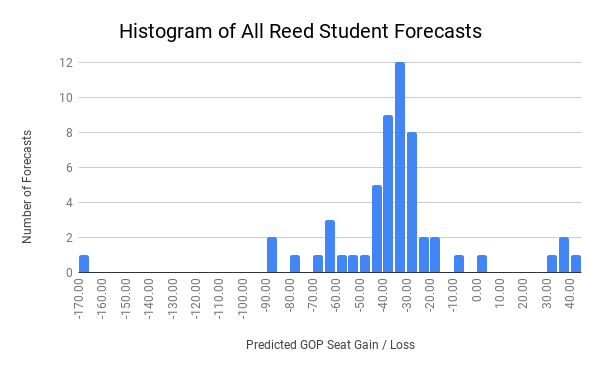
Or perhaps a math error? We shall investigate tomorrow in class.
When we remove outliers (any forecast < -50 seats and > -10 seats), the average student forecast is a 31 seat loss for the GOP, which would of course result in a Democratic takeover of the House.
There seems to be no patterns of unusual forecasts by section. (We allowed students to collaborate in groups of up to 3. The blank values are student teams who combined work across sections.)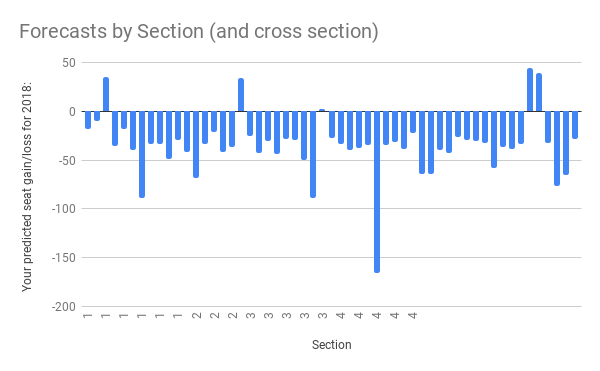
I know you all have been waiting for the silly variables, so I won’t hold you in suspense any longer. A number of these additional predictors sound distinctly non-silly. Apparently, irony is dead in 2018.
The list of silly variables (not Silly Party): 
- Number of hurricanes in a given year
- Number of Beach Boys Concerts
- Length of the Tour de France (in km)
- Solar Flares
- Number of reported manslaughters
- President’s age
- Percent increase in motor vehicle deaths from the previous year
- Percent increase in patent filings Oil price change
- Shark attacks (hello, Achen and Bartels?)
- Ratio of US Growth rate to World Growth rate
- Shoe size (whose shoe size?)
- Percent Atheist (Reed hates the College admissions ranking game, unless its this ranking game)
- Pneumonia and influenza mortality rate
- Average national rainfall (blame Derek Willis)
- Apparent (??) per capita ethanol consumption
Thanks to Laura Swann ’19 who helped to prepare this year’s forecasting assignment and Kristin Bott, Associate Director of Computing and Information Services, who helped write our assignment materials last year.