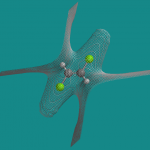
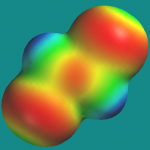
This question is asked in a particularly interesting way by G.E. Höst et al in the December issue of J. Chem. Ed. (“Students’ Use of Three Different Visual Representations to Interpret Whether Molecules are Polar or Nonpolar”, DOI: 10.1021/ed2001895). They presented students with three types of pictures:
- positive and negative isopotential surfaces rendered in blue and red (RB)
- an electrostatic potential map on an isodensity surface (MAP)
- an isopotential surface for the node in potential, i.e., the surface(s) that separate regions of positive and negative potential (ISO)
and they correlated student performance, i.e., whether a student could correctly say whether a molecule was polar or nonpolar, and how long it took for them to reach that decision, with the type of picture. Here are ISO and MAP pictures of trans-1,2-dichloroethene:
Perhaps the most interesting aspect of this project is the innovative thinking that went into finding pictures (RB, MAP, ISO) that might be useful to students. I had never considered the properties or utility of the zero potential (ISO) surface myself.
I hope this article will inspire more teachers to consider the variety of pictures that can be generated and also the powerful impact they can have.


