by Nanati Safawo
Schizophrenia is a neurodevelopmental disorder and it is caused when the brain is not formed normally in early life. Some of the symptoms can include delusions, hallucinations, disorganized speech, trouble with thinking, and lack of motivation. Emerging studies are showing that Schizophrenia can impede neuronal network formation and neurodevelopmental processes such as differentiation and migration(Berreta, 2016). Since The Extracellular Matrix (ECM) plays a key role in the regulation of cell differentiation and migration and axonal outgrowth and guidance (Bandtlow and Zimmermann, 2000), we predict that aberrant interaction between the neurons and(ECM) could cause disruption observed in Schizophrenia.
Our project is studying the neuronal-ECM relationships, and how ECM signaling dictates the differentiation of neuroblasts, axonal extensions, and neuronal architecture of neurons and is comparing these developments in terms of their axonal extension across different substrates of ECM and Concanavalin A (Con A). Our long-term goal is to understand what could cause the aberrant interaction between neurons and ECM.
ECM is a large network of proteins and other molecules that surround, support, and give structure to cells and tissues in the body. It plays a critical role in dictating cellular behavior. In addition, ECM also helps cells attach to, and communicate with nearby cells and plays an important role in cell growth, movement, and other cell functions. Con- A, our other substrate, is a lectin that does not engage ECM receptors and thus does not convey vital signaling information to neurons. Con A is used because the cells stick well but there is no real biologically significant signaling that is happening. Hence using it as a substrate could act as a control to aid our understanding of how ECM dictates neuronal behavior and how neurons across species interact with their extracellular environment.
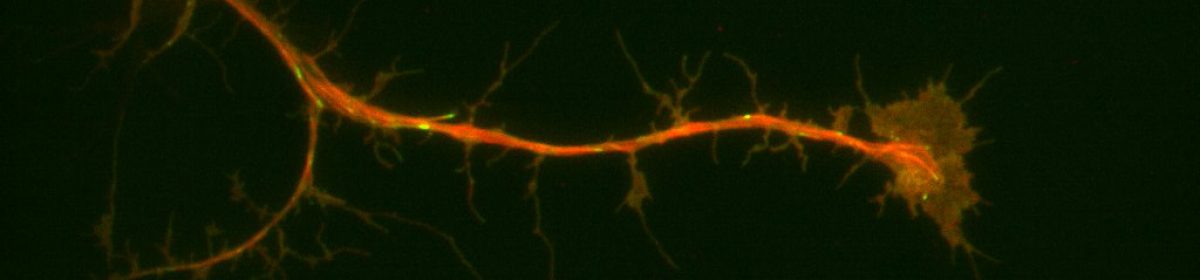
Neuronal progenitor cells from the brain of Drosophila melanogaster (fruit flies) is our preferred system to study the neuronal-ECM relationships. During neurogenesis, neuroblasts undergo a series of divisions either producing more of themselves or differentiating into neurons or glia1. Brains from larvae, which are enriched in neuroblasts, were removed and cultured for days. This system is ideal for detailed, high-resolution microscopy and exploring signaling from the ECM since it has formerly led to fundamental discoveries furthering our understanding of neurons and neurogenesis. Additionally, purified ECM is more biologically relevant because when coupled with compliant substrates, it mimics the softer environments of brains representing a powerful system allowing us to probe ECM-neuronal interactions from several different axes. Our preliminary data suggested that neurons plated on nECM behave differently than those plated on Con A. We collected Neuroblasts from third-instar larval with the genetic background of (Prospero-GAL4xUAS-EB1::EGFP; UAS-Jupiter::mCherry) and plated them on the substrate of either ECM or ConA. We used TIRF microscopy for imaging and observing the development of our neurons. In parallel with our predictions, we replicated former lab findings demonstrating that microtubule dynamics and axonal extensions increased in neurons plated on ECM compared to con A.
Another line of inquiry we pursued was using the UAS-RNAi fly line in combination with the inscrutable-Gal4 driver to deplete the major adhesion molecule, Syndecan, and observe neuroblast behavior when plated on ECM and Con A. Interestingly, the results we got from these were quite surprising. The neurons plated on ECM did not show much growth and had axonal extensions. The neurons were unable to sense the signaling from the ECM and did not develop or show axonal extensions; instead, they either died or showed minimal development. This result suggests that Syndecan might contribute significantly to the regulation of the neuronal-ECM interaction. Furthermore, it could have an impact on the axonal growth of neurons on ECM, neuronal differentiation, and overall neuronal development which in turn might contribute to the cause of SZ. We are currently working on replicating these results and I am excited to see what we will find out.
Berretta, S. (2012a, March). Extracellular matrix abnormalities in schizophrenia. Neuropharmacology. https://www.ncbi.nlm.nih.gov/pmc/articles/PMC3234338/#R18
Berretta, S. (2012b, March). Extracellular matrix abnormalities in schizophrenia. Neuropharmacology. https://www.ncbi.nlm.nih.gov/pmc/articles/PMC3234338/#R18
Stephen J Glatt, Stephen V Faraone, Ming T Tsuang. (n.d.). Is Schizophrenia A Neurodevelopmental Disorder?. Academic.oup.com. https://academic.oup.com/book/40600/chapter-abstract/348206860?redirectedFrom=fulltex
Author: applewhd
‘Polarizing’ Adventures: Microtubules Lead the Way
-By Nicole Chan
Cell migration depends on the dynamics of the actin and microtubule cytoskeleton. Classically, the actin cytoskeleton is the “engine” of migration, driving cell protrusion. The microtubule cytoskeleton has long been hypothesized to play the role of “compass”, dictating the direction of migration. Another key element to cell migration is focal adhesions, plague-like structures made up of some 120 different proteins that connect the cytoskeleton to the extracellular matrix (ECM). To put it all together briefly, protrusion from the actin cytoskeleton lays the groundwork for the formation of focal adhesions which mature and strengthen the more the cell physically pulls on them. Meanwhile, microtubules direct where protrusions occur and effectively steer the cell. Focal adhesion expression and dynamics also correlate strongly with metastasis in human epithelial cancers which is why studying them has important ramifications for human health. A recent publication on focal adhesions from the Applewhite lab has found that disruption of microtubule polarity (via depletion of the major actin-microtubule cross-linking factor known as Short stop of Shot) results in faster focal adhesion turnover. This ultimately results in faster cell migration (Zhao, AJ., Montes-Liang J., et al, 2022). If disruption of microtubule alignment with actin and focal adhesions led to faster focal adhesion turnover, we wondered what would happen to focal adhesion dynamics if microtubule polarity was forced in the direction of migration. Drosophila cells are a somewhat naive system to test these ideas as they lack an active centrosome during interphase. By expressing a constitutively active Polo Kinase construct, we can activate the centrosome, leading to the formation of a microtubule organization center which then can force the microtubules, putatively in the direction of migration. Results from Summer 2023 research, indicate a presence of a centriole-like structure that organizes the microtubules. It is our hypothesis that this forced polarity will result in cell-matrix adhesions that will last longer, but it is not known how this impacts cell migration. The primary question driving this project is how Drosophila cell-matrix adhesion dynamics behave in cells with or without active centrosomes. However, due to the short timeline, I will be aiming to quantify cell-matrix adhesion dynamics in cells with and without centrosomes.
Zhao, A. J., Montes-Laing, J., Perry, W. M. G., Shiratori, M., Merfeld, E., Rogers, S. L., & Applewhite, D. A. (2022). The Drosophila spectraplakin Short stop regulates focal adhesion dynamics by cross-linking microtubules and actin. Molecular biology of the cell, 33(5), ar19. https://doi.org/10.1091/mbc.E21-09-0434
Computer Assisted Image Analysis.
Hey everyone! I am Maham Zia and this summer I worked as a post-bacc for Anna Ritz (primary advisor) and Derek Applewhite (co-advisor). I graduated from Reed in May 2020 with a degree in Physics, but during my undergraduate career I worked in a cell biology and cellular biophysics lab. I am interested in how physics interacts with other disciplines such as biology and chemistry. I believe that interdisciplinary research transcends boundaries and aids the scientific community to think about a variety of problems in creative ways.
This summer I put my coding skills to use by working on a computational project that involved analyzing images of cells. For her senior thesis, Madelyn O’ Kelley-Bangsberg ’19 used the punctate/diffuse index to measure the distribution of phosphorylated NMII Sqh. Punctate/diffuse index is widely used to measure the spread of cytochrome c in cells during apoptosis. Measuring this index involves determining standard deviation of the average brightness of the pixels using time lapse microscopy [1]. O’Kelley-Bangsberg’19 used the same idea to determine whether the cell has punctate phosphorylated myosin (high pixel intensity standard deviation) or diffuse phosphorylated myosin (low pixel intensity standard deviation). She did this in ImageJ by outlining each cell, obtaining an X-Y plot of the intensity and finally calculating the relative standard deviation ((standard deviation/mean pixel intensity) x 100 ) by setting the highest intensity value to 1 and lowest intensity value to 0. She used relative standard deviation instead of the absolute standard deviation to draw comparisons because she observed that mean pixel intensity values changed significantly between treatments [1]. Under Anna’s guidance I worked on automating this process in MATLAB by making use of image processing techniques which made the entire process a lot more time efficient.
I was working with images that each had two channels:
- An actin channel that shows the distribution of actin- a double helical polymer that aids in cell locomotion and gives the cell its shape. Since actin is distributed throughout the cell, staining it allows us to see the entire cell [2].
- A channel showing the distribution of phosphorylated NMII Sqh.
The general idea was to use the actin image to detect/outline the cells and somehow use that information to plot the cell outline on the second image which has the distribution of the phosphorylated NM II Sqh. Plotting them would allow me to obtain the intensity values of the pixels within each cell and determine the standard deviation of the pixel intensity values for each cell.
Initially, my code read in the image with the actin staining and used the inbuilt imfindcircles function in MATLAB to detect cells in the actin image. One of the input arguments of the function is radiusRange which can be used to detect circles with radii within a certain range. However, the function doesn’t work well for ranges bigger than approximately 50 pixels which means it doesn’t work well for images with both small and large cells. Moreover, the function has an internal sensitivity threshold used for detecting the cells. Sensitivity (number between 0 and 1) can be modified by putting it in as an optional argument when calling the function, but increasing it too much leads to false detections [3]. Using imfindcircles function is not a robust way to detect cells and therefore I decided to switch to the drawfreehand function in MATLAB 2020 that allows the user to interactively create a region of interest (ROI) object.

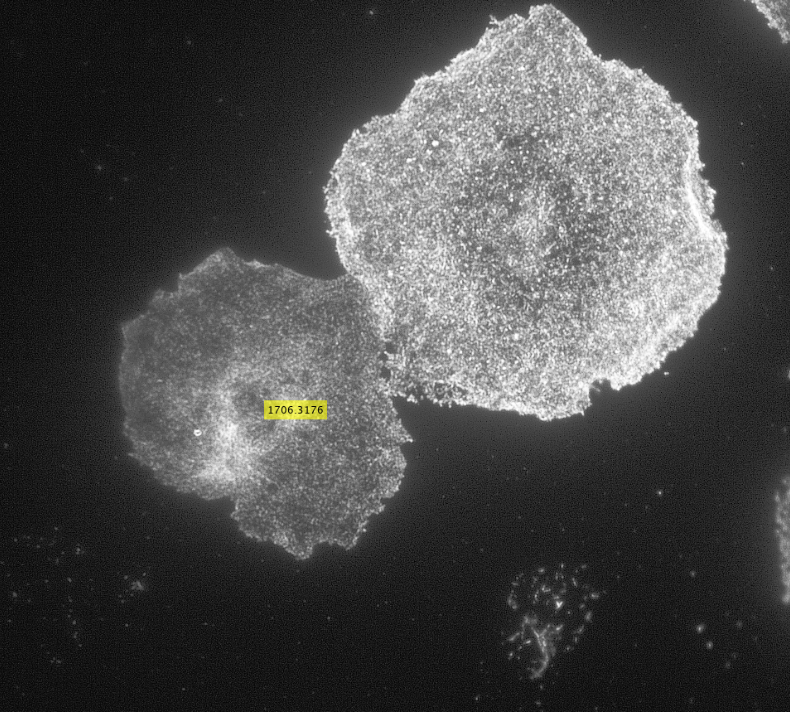
After creating the ROI object (in simple terms that means outlining the cell) as shown in the figure above, I created a binary mask and used regionprops to get the centroid and the equivalent diameter of the object.
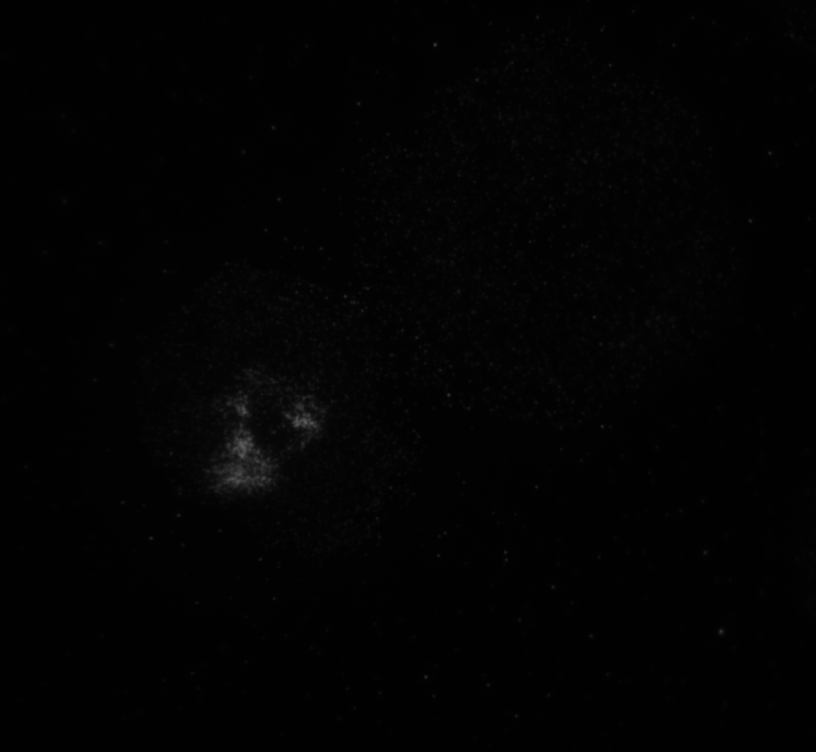
The code then read in the second image as shown in image below with the distribution of the phosphorylated NMII Sqh and used outputs from regionprops and the impixel function to get the pixel intensity values for each cell. This image mostly looks dark because it is only showing the distribution of phosphorylated NMII Sqh which is the small cluster of bright pixels we see.
Impixel function takes the column and row indices of the pixels to be sampled and gives their pixel intensity values. However, lengths of column and row vectors need to be the same and since I was approximating the cells as circles, the only way to extract the intensity values of the pixels was to think of the circle as enclosed in a square. So, I used the center coordinates and radii of the circles to get coordinates of the top left corner of the square and used the linspace function to get equally spaced vectors for column and row. Finally, std2 and insertText functions were used for calculating the standard deviation values and displaying them on the image showing the actin distribution respectively.
Future goals could involve analyzing a number of images to determine reasonable standard deviation values and finding a way to extract pixel intensity values for pixels only within the ROI object instead of a square enclosing the object to calculate standard deviation values.
Now that I am done with this project, for this upcoming year I will be working as a research assistant in a lab part of the department of Genetics, Cell Biology, and Development at the University of Minnesota.
References:
[1] M. O’Kelley-Bangsberg, Reed undergraduate thesis (2019)
[2] J. Wilson and T. Hunt, Molecular Biology of the Cell: The Problems Book (Gar- land Science, New York, NY, 2008), 5th ed., ISBN 978-0-8153-4110-9, oCLC: 254255562.
[3] MathWorks, “Detect and Measure Circular Objects in an Image”, https://www.mathworks.com/help/images/detect-and-measure-circular-objects-in-an-image.html
Hello world!
Welcome to Reed College Blogs. This is your first post. Edit or delete it, then start blogging!