In the previous post we described how the data is collected using Traction Force Microscopy (TFM). The process of imaging outputs several “movies,” which display the cells exerting forces and moving the beads embedded in the compliant gel matrix.
The data analysis algorithm is threefold: 1) tracking, 2) low-pass filtering, and 3) calculating traction stresses.
To calculate the displacements of the beads, a reference image of the beads on a plain compliant matrix is compared to an image of the beads on a compliant matrix with the cell on top of it which then pulls on the substrate near its edges. Using an array containing the tracked particle data for each frame of the movie, the displacements are extrapolated with stochastic drift taken into account. These data are then output onto an XY grid at each time interval.
Then, a low pass-filter is added to remove the high-frequency noise from the displacement data.
Next, the displacement data is correlated to the traction stresses through an algorithm derived by Style et. al. (2014) along with the elasticity theory, which states that the properties of the compliant matrix such as thickness, stiffness, and compressibility must be taken into account when considering traction stresses, which are continuous distributions of forces (Abidi, 2016). Modeling the gel as a “spring,” we can use Hooke’s Law, F=-kx, where k is the elasticity constant, x is displacement, and F is the force.
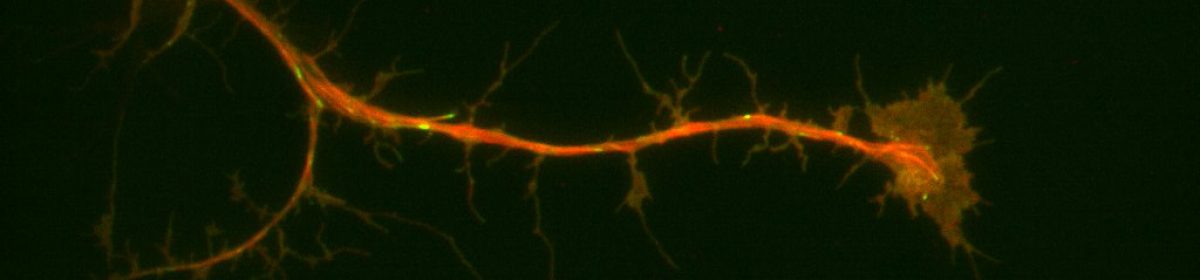
Finally, once the traction stresses have been computed, we will overlay a plot of the displacement and traction stress vectors on top of an image of the cell, as shown in Figure 1 (Abidi, 2016).
Figure 1: A force vector field calculated by Abidi (2016) using example data from Style et. al. (2014)

References
Abrar A. Abidi. Quantifying cellular mechanotransduction in morphogenesis and cancer. Reed College, 2016.
Robert W Style, Rotislav Boltyanskiy, Guy K German, Callen Hyland, Christopher W MacMinn, Aaron F Mertz, Larry A Wilen, Ye Xu, and Eric R Dufresne. Traction force microscopy in physics and biology. Soft Matter, 10(23):4047-4055, 2014.
