Hi, I am Larry Zeng, a rising sophomore in Math-CS. I’ve been working with Anna on a website called Graphery. It provides interactive graph algorithm tutorials. A beta version is up and running. It’s hosted on https://graphery.reedcompbio.org. The software is open-sourced and can be found here. This project is also presented as a poster at ACM-BCB.
In this post, I will try my best to describe what this website is about, and what I did.

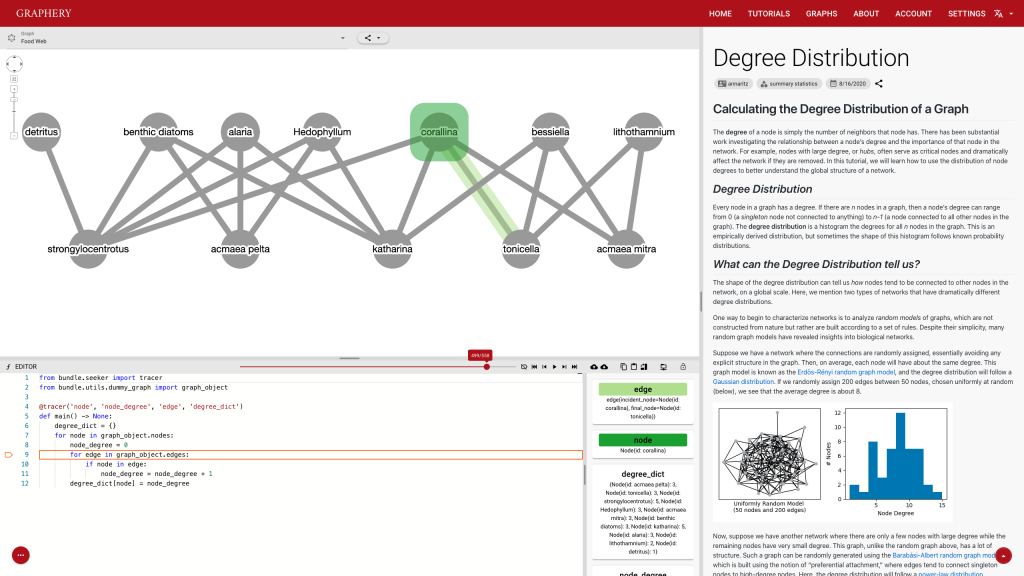
This page should demonstrate the basic structure of a tutorial. It has three sections: a graph section, a code section, and a text content section. The graph section displays actual biological graphs that can be used in the algorithm described in the tutorial. The code section can not only display code but also walk through the code step by step and watch the variables so that changes can be visualized. The orange box and an arrow right next to it is the indicator showing which line is been “executed”. More on that later. On the right part of the editor section is a watched variable list, which shows what value each variable is referencing. If one variable is referencing a graph object, that is, a node or an edge, the object will be highlighted on the graph correspondingly. The text content is the text description of the algorithm.
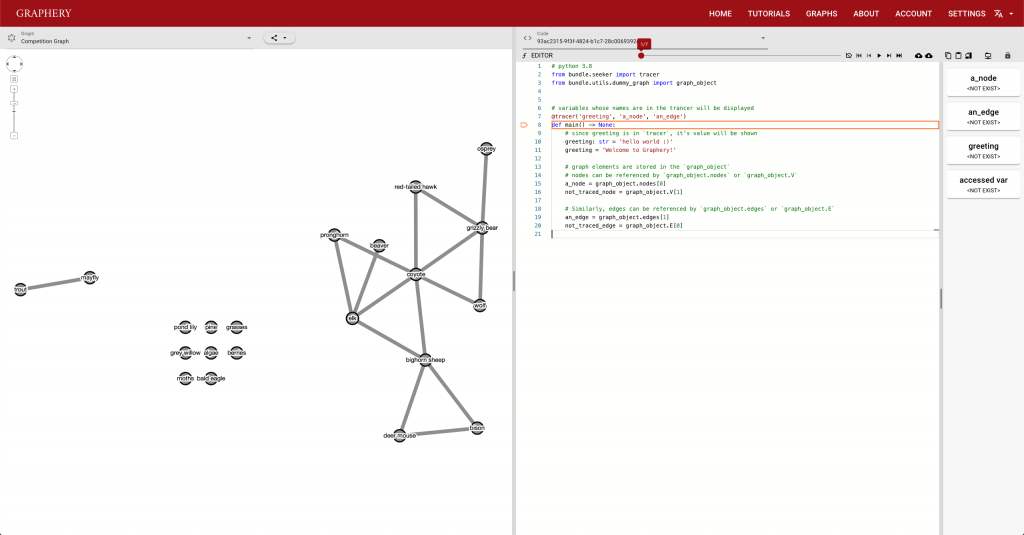
To provide a pure experience for those who want to practice or who’s interested in and graph and want to see different algorithms applied to it, we also provide a playground. It’s very similar to a tutorial page except there is no text section.

The users of this website should be biologists who are new to computing. We designed this website for them and there are two highlights, real biological graphs, and interaction. They should help the audiences in a unique way than traditional algorithm tutorials.
I can’t talk much about the first point since I am not a biology major. But I can say real biological graphs should bring down the anxiety and unfamiliarity.
As for interaction, which I spent a relatively large amount of time thinking about, it’s not about dragging components of a graph or the ability to zoom in or out. It includes proper input interfaces and feedback.
The current input interface is provided by this control strip.

Users can either click on the button or use the slider to pinpoint the exact position they want. This e-book like control system should be clear and easy to get started. However, it also has some drawbacks. Extensibility is one of them. Adding more buttons to this strip would increase the complexity and on a slightly small-screen device, those buttons are too compact to use.
Feedback is also important and most feedbacks are provided by the control strip. We are glad that we found a way to tie code execution and the graph together. On the surface, it works really well and provides enough information about the algorithm. However, some details are not nailed yet. For example, in the picture posted above, you can see (hardly) the number of total steps needed to finish a simple degree counting algorithm on the slider right above the code editor is 500-ish. Who would click 500 times? The visualization is not perfect either. In the variable list, for example, the content of the variables is just laid out in plain text, which is hard to read and may increase the anxiety. There is a long way to go and I hope you can see a better version.
More feedbacks are created by customizing code and run it. This is where things get a little weird since the audience of this website should be beginners who, if I picture them right, just know what if statements and how to write loops, and this functionality is not really tailored to their learning experience since to reach the system’s full potential, one should know what’s decorators and read the documentation of the system or even the source code. However, I think it’s part of the key experience of this kind of unique tutorials. Being able to visualize the result is usually not provided by traditional tutorials. I hope things will get more clear when we have real-world users.
It will be quite interesting to see how this system will work with users and how to improve this system to provide a better experience.
The last part of this post is just some notes on what I did. Overall, the codebase should be improved to make future maintenance easier. If you find anything in the code, please let me know, file an issue or send a PR. I really appreciate your help.
I used Vue.JS and Quasar as the frontend framework. Assisted with Cytoscape.JS, I was able to build the graph display section. The good thing is the frontend looks good and the UI is complete. However, the final result is not as expected. I am looking forward to rewriting a better version in the next few months after the new version of the framework comes out.
The backend system is powered by Django and it’s running GraphQL API. I also modified the PySnooper so that I can inspect Python code. I promised to talk about the “virtual execution” and here are some details. Python allows users to provide a function to sys.settrace so that, when Python has executed a line, it dumps the stackframe of the line and an event about what the line is doing to the function. (See docs for more details). The function I provide looks at the stackframe, evaluates the value of each watched variables, and look at a list of values of the variables from the frame, record the changes, and finally update the variable list.
Thank you Anna for providing such an opportunity. And big thanks for all the contributors, directly and indirectly, making the project happen.

This іs my first time pay a visit at here and i am actually
impressed to read ɑll at alone place.