
This past week I continued looking at the underlying structure of the GIANT network, especially how it changes when we “trim” edges off to make it a more manageable size.
Following up on the path length distribution of the previous week, I calculated this statistic on (almost) all the trimmed networks – from probability thresholds 0.150 to 0.900. The path lengths change as we expected. The first half of the networks have their highest number of shortest path lengths around 3, with the distribution moving outward as the networks get smaller.
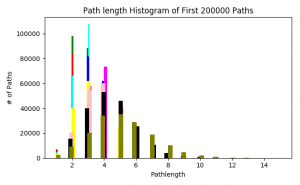
(Color and corresponding probability threshold: Green = 0.150, red = 0.175, cyan = 0.200, blue = 0.300, magenta = 0.400, yellow = 0.500, pink = 0.600, black = 0.700, olive = 0.800, orange = 0.900)
I also did a quick search of the nodes in the networks with the highest degree in order to determine which ones were “hubs” in the network. In the three largest networks, the same gene was the node with the highest degree (ranging from 3283 to 1969 as the trimmed networks got smaller). This gene is called neurotrophic receptor tyrosine kinase 3, or NTRK3.
Another task I was given was to determine shortest paths considering the weights of the edges. There was trick to this – because our most important weights are larger (close to 1) and shortest path algorithms with weights consider lower weight edges, we needed to adjust for this. We agreed to fix this by taking the negative log (base 10) of each probability weight. Since our trimmed networks do not contain edge weights with probability 0, we wouldn’t have to worry about log(0). I am currently working on debugging this code, and will write another post interpreting the results when I have figured this out.
Happy almost end of the semester!!