
With our big CNB-MAC paper deadline passed last Friday, my tasks this week have been relatively simple. My first goal this week was to take the bar chart figures in the paper and turn them into box and whisker plots.
For example, I took this figure:
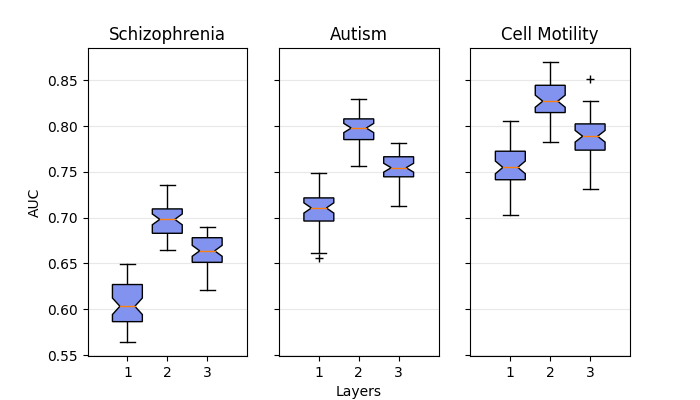
and turned it into this:
The bar chart figure shows the mean AUC of each positive set with varying number of layers, while my figure is a little more descriptive. It shows the mean AUC as well as the interquartile range and outliers.
Next, we got some surprising news! We were notified that after a preliminary pass of the paper submissions, our paper was accepted to the CNB-MAC conference as either a talk or a poster (we’re still waiting to hear which one.) This gave us the opportunity to submit a two-page abstract by the end of next week, a more challenging task. I wrote up a quick rough draft that I will continue working on next week with Alex.
Finally, with our results generated and our paper submitted, it was time to clean up our github repo. This included deleting a lot of old code and useless output files as well as restructuring the code and writing README.md files. It’s looking a lot better now!