
Hi! My name is Hannah Kuder, I’m a rising math-physics senior working in Anna Ritz’s lab this summer. My project has focused on implementing a graphlet-based version of the Markov Clustering (MCL) algorithm on various biological interactomes in order to compare those clusterings to normal MCL. In particular, whether any of the graphlets cluster disease genes “better”.
Graphlets
To put it simply, graphlets are connected induced subgraphs. Starting at G0, we have all of the connected induced subgraphs that can be created from 2 nodes, which is just an edge. I focused this project on graphlets up to 5 nodes.
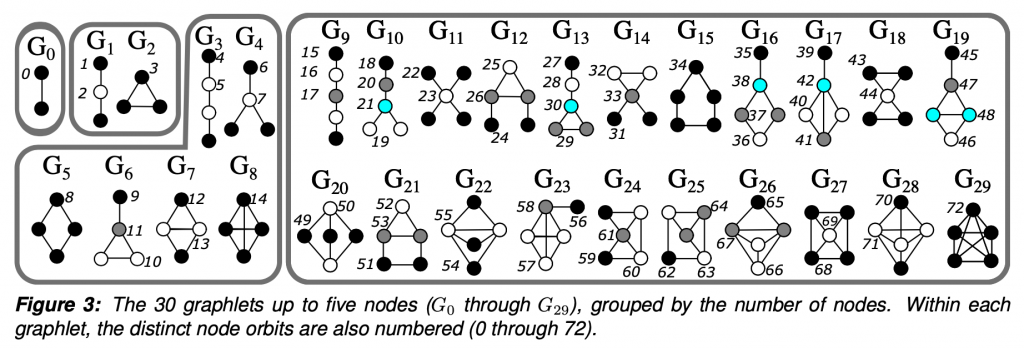
The “induced” part of the definition means that given a subgraph that looks exactly like G29, a 5 node clique, we would not say that G15, the 5 node ring is also present. Given 5 connected nodes, there is only one 5 node graphlet present. The graphlet must contain all of the edges between the selected nodes.
So why graphlets? They are a way to investigate patterns and the higher order structure of the network. In between the very local level of two nodes being connected by an edge, which doesn’t tell us about any greater trends, but much less global than a statistic such as density, which misses much of the network-specific intricacies.
Markov Clustering
Markov Clustering essentially simulates a random walk. Given an edge list, MCL creates a transition matrix, where every column and row represent a node with the entry [i,j] being the probability a transition from one node to the other could occur. MCL then cycles between two steps: expansion and inflation.
- Expansion simulates a normal random walk (taking the power of the probability matrix using the normal matrix product)
- Inflation accentuates high probabilities and diminishes lower probabilities (taking the power entrywise aka the Hadamard power)
In the implementation of MCL, there is a parameter you can choose called the “inflation parameter” which controls how far those probabilities are exaggerated. A lower inflation parameter means less “inflation” and thus a coarser clustering and larger clusters, while a higher inflation parameter produces more, smaller clusters. Which inflation parameter to use is dependent on both the specific network and your goals.
Graphlet-Based MCL
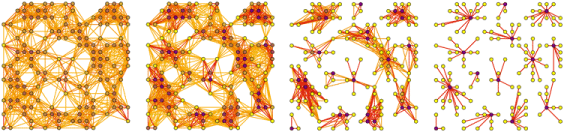
So the main idea behind this project is to combine the two and see if any graphlet-based versions of MCL uncover anything insightful that normal MCL could not. To combine the two, for a given graphlet, all of the edges that did not participate in the given graphlet were deleted. MCL then performed clustering on the graph that remained. Thus we are left with 30 different clusterings of the same network.
Specifically, I have been focusing on a protein-protein interactome (ppi) with 21,559 proteins and 342,353 edges. This interactome contains genes associated with 519 diseases. Each of the 30 different versions of MCL produced different clusterings of these genes. I am currently trying to compare the results of the different higher-order graphlets to G0, which is normal MCL.
Here are a couple Venn diagrams comparing the “best” clusters from G0 and G29 for a couple diseases. “Best” means the cluster had the most disease genes in it.
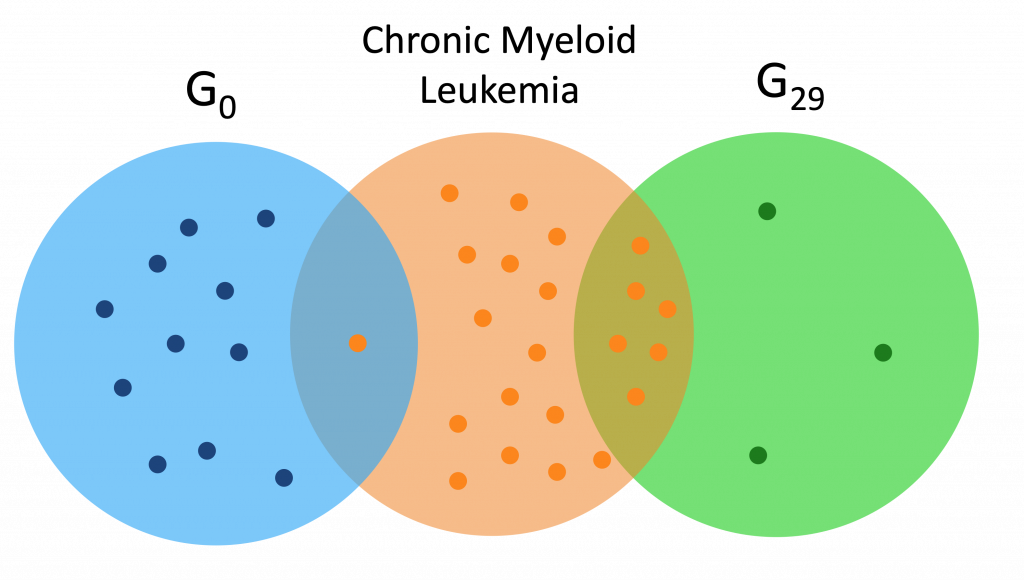
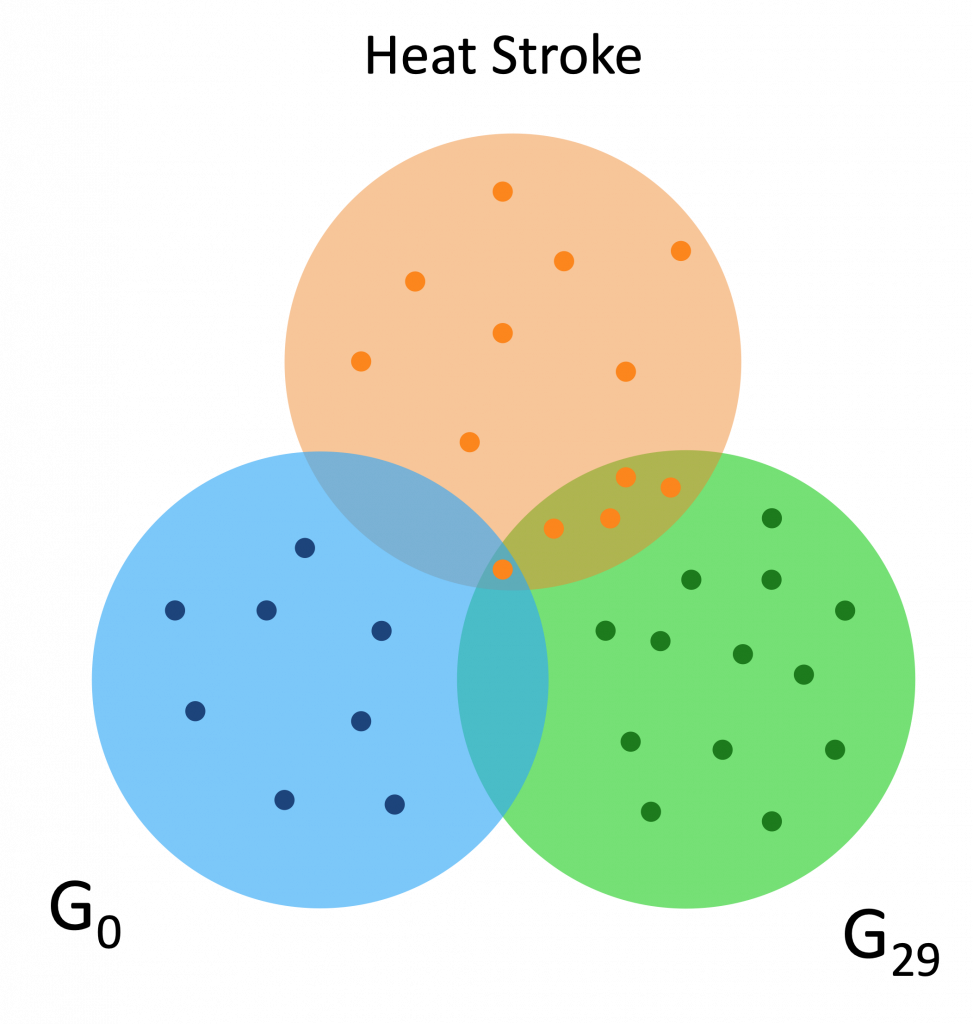
We see that in these diseases, the best cluster of G29 is much more enriched than the best cluster of G0.
I have also calculated the hypergeometric score for each of these best clusters across all of the diseases, which is the probability that given N disease genes in a pool of M total genes, that a cluster with m genes would contain n disease genes. Essentially, is the number of disease genes in that cluster significant? Or is it likely to happen just by chance.
A problem I am facing with these hypergeometric scores is how to compare the probabilities across different graphlets, and hopefully I’ll figure something out before my research ends next week.