
Hi all! My name is Aryeh Stahl and I’m a math and computer science dual major at Reed. I’ll be a senior this fall and will be starting my thesis. I had a great time working with Anna this summer!
An interactome is a weighted graph with nodes representing proteins and directed edges representing interactions between these proteins. Anna Ritz et al. (2015) previously developed Pathlinker, an algorithm that finds k-shortest paths from a set of source nodes to a set of target nodes. It aims to “to reconstruct the interactions in a signaling pathway of interest [2].”
In my project, I aimed to integrate cancer data into the previously generated Pathlinker interactome to find significant pathways and/or proteins involved in a given cancer. I obtained driver p-values for most proteins in the interactome. These p-values “indicate [genes’] statistical significance as drivers, according to diverse methods that account for positive selection, functional impact of mutations [and] regional mutation rates [1].”
Once I had mapped these p-values to the corresponding proteins in the Pathlinker interactome, I created new interactomes by diffusing the p-values to outgoing edges and calculating a weighted average with the old edge scores. For example, if a node had p-value of 0.5 and had 5 outgoing edges, the corresponding contribution would be 0.1 for each of the 5 outgoing edges. I then set a parameter, beta, which indicated the weight of the new values and the weight of the old values. If beta = 0, then all of the new edge weight is obtained from the p-value, while beta = 1 will give the original interactome. The following GIF shows the distribution of edge weights as beta changes (beta is 0 when most of the scores are close to 0, while beta is 1 when it is very discrete).
The input to Pathlinker is an interactome, as well as two sets of nodes: targets and sources. The output is a list of proteins and interactions, ranked “by their first occurrence in the k shortest paths from any [source] to any [target] [2].” So, I can run Pathlinker on my new interactomes and get as output a list of significant edges. Ideally, these edges would be significant in the pathway in question (such as the WNT signaling pathway), and for the cancer. Thus, we could identify potential interactions that could be disrupted and contribute to the cancer.
My next issue was to determine if my output was actually significant. I tried to do this by fabricating some data and seeing if my method recovered the edges that I expected. I created randomly weighted interactomes and chose a previously known signaling pathway as a subgraph (in this case I used WNT). I shall call this subgraph A. I then chose some scale factor to upweight the edges in that subgraph, e.g. multiplying each edge weight by a factor of 1.5. Next, I chose a random subset of the nodes of subgraph A (of a specified size, say 50% of the nodes) to serve as an intersection with another subgraph, which I shall call subgraph B. B corresponds to nodes with a high p-value in the cancer data. I then added some more nodes that are connected to this intersection and are outside A (Thus making subgraph B have the same number of nodes as subgraph A). I finally gave each of the nodes in subgraph B a high p-value and created a new interactome.
Running Pathlinker on this contrived data with the WNT sources and targets, I would expect a high percentage of the resultant significant edges would be in the intersection between subgraph A and subgraph B. I further would expect to have a larger number of the significant edges in the intersection as I upweight subgraph by a larger factor. This is exactly what I got. The following plot shows the results from several trials of Pathlinker on new interactomes with a various upweight factor, finding the k = 100 shortest paths. 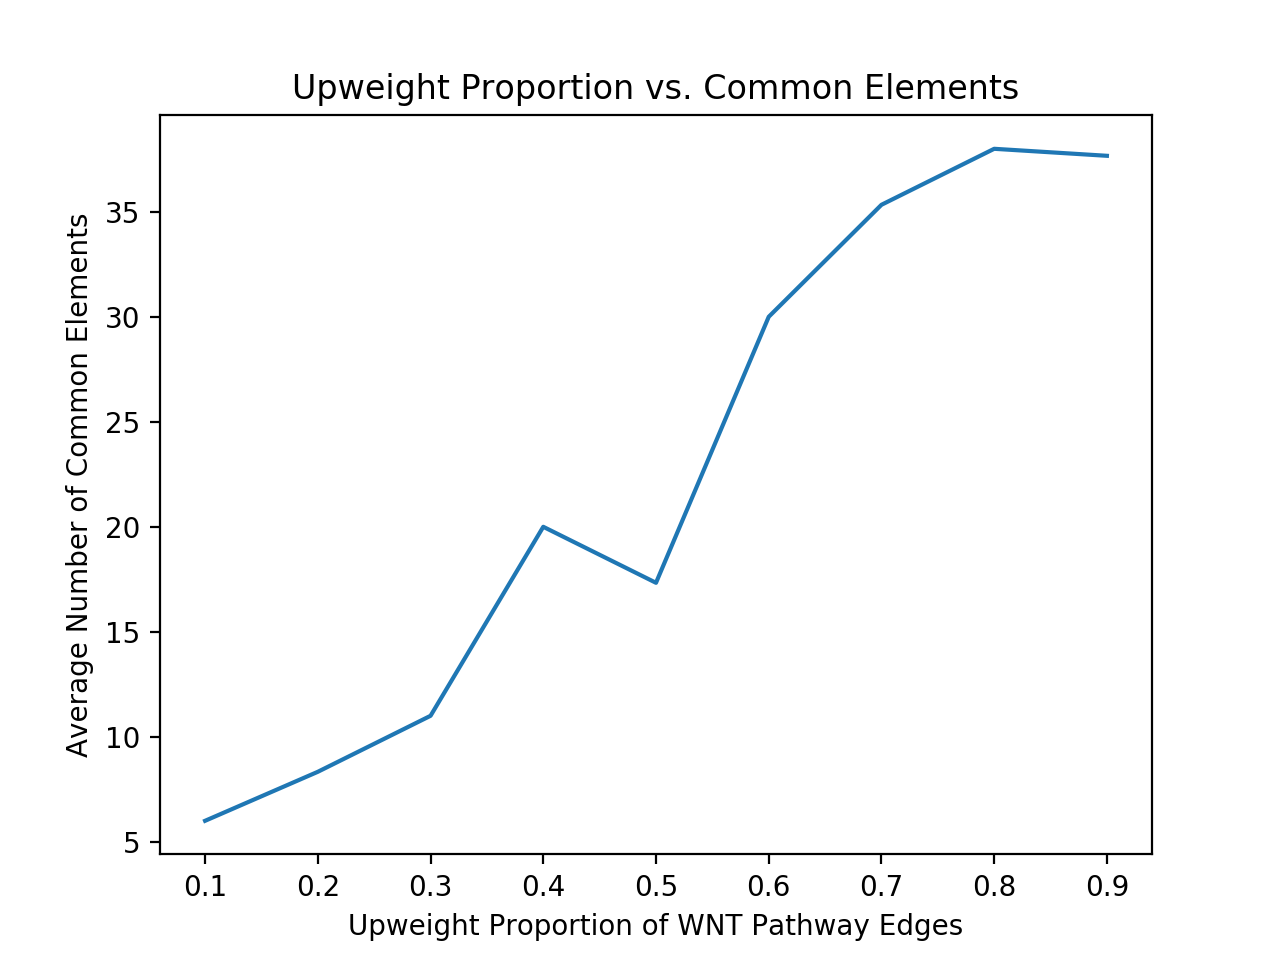
References
[1] Reyna, M.A., Haan, D., Paczkowska, M. et al. Pathway and network analysis of more than 2500
whole cancer genomes. Nat Commun 11, 729 (2020). https://doi.org/10.1038/s41467-020-14367-0
[2] Ritz, A., Poirel, C., Tegge, A. et al. Pathways on demand: automated reconstruction of human
signaling networks. npj Syst Biol Appl 2, 16002 (2016). https://doi.org/10.1038/npjsba.2016.2