You responded on the board. By adding to the board, you offered a piece of information — data about yourself — and collectively created a dataset. Anyone walking by the board, including yourself, could view and “access” that data. One challenge with data for research is that not all of it is public, open, or accessible, though different movements nowadays are calling for accountability and transparency in data collection and sharing.
Did the data tell your story?
Even though you contributed to a dataset, there could be many possible flaws or issues with the data that could in its worst form be devastating for you and your communities.
What do you notice about the questions that were asked? What about the categories of food? Is that the only way people have categorized food? What kinds of food are missing? Who do you think answered the questions (what are the demographics)? Does it represent the community? Does it represent you?
“By identifying existing data-driven narratives that align, or don’t, with our lived experiences and naming gaps in available information, we can start to define and create new datasets that let us tell the full stories of our communities”
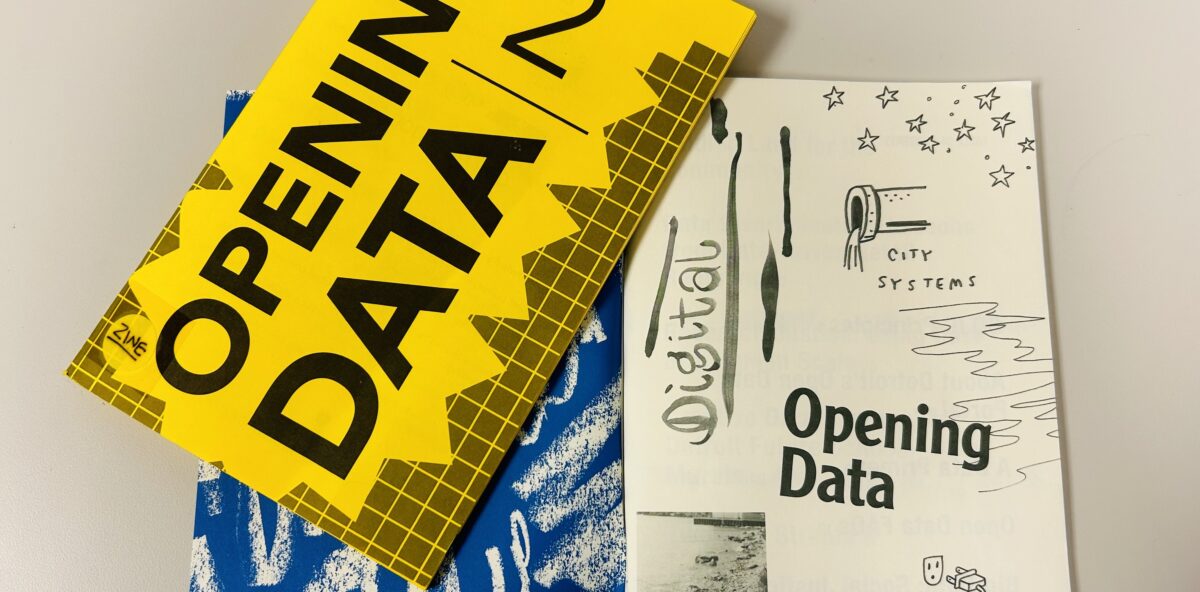
Opening Data Zine, page 9
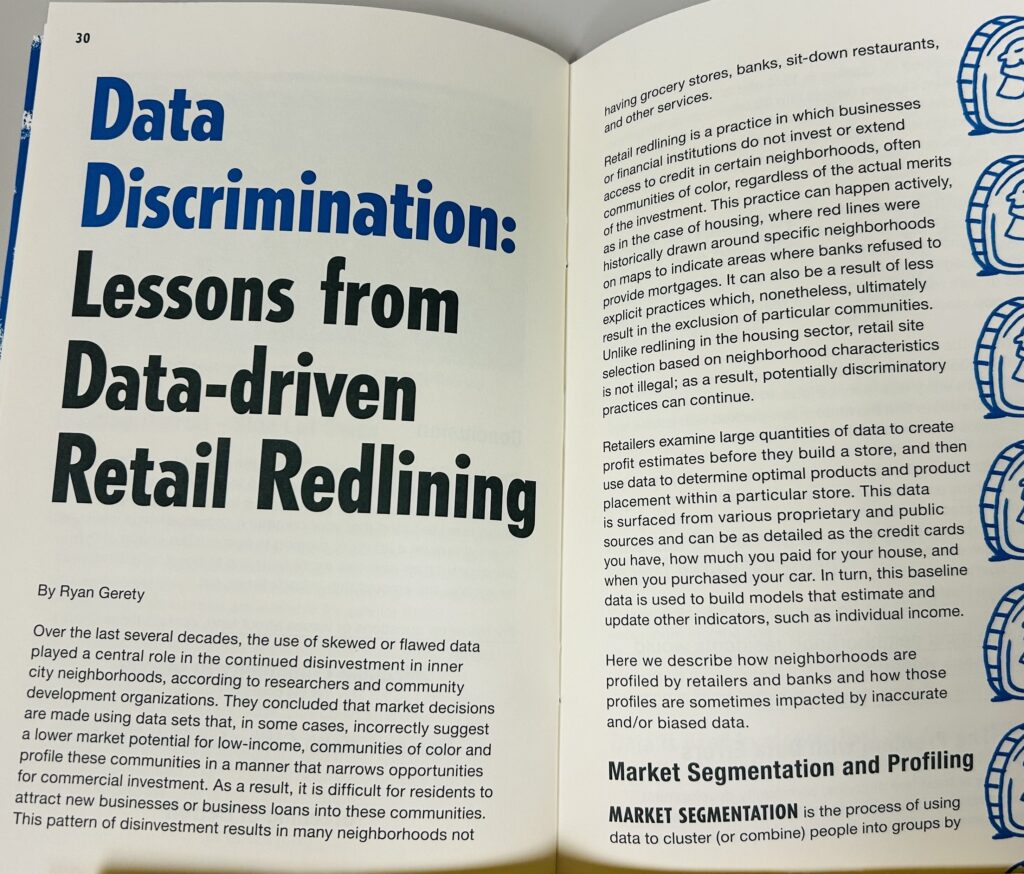
Read this excerpt from the Opening Data Zine for an example documenting “retail redlining”:
Remember that data is read by humans with biases, and those biases inform how people understand data and how they attribute value, or interpret, that data, such as looking for data to back up held beliefs or pre-made claims. Also, some data sources, such as the well-known census, can be skewed in other ways, with some groups or communities underreporting and being undercounted (for various reasons). Covid-19 proved a critical moment for collecting health data on marginalized and underrepresented populations that weren’t readily available before.
Interested in learning more about data research? Check out these resources:
- Reed College’s Data @ Reed
- Data-driven learning guides provided by ICPSR
- Guide to finding data about race and ethnic bias by IASSIST
Love Data Week 2024‘s theme is “My Kind of Data” and is all about data equity, inclusion, and creating a kinder world through data.