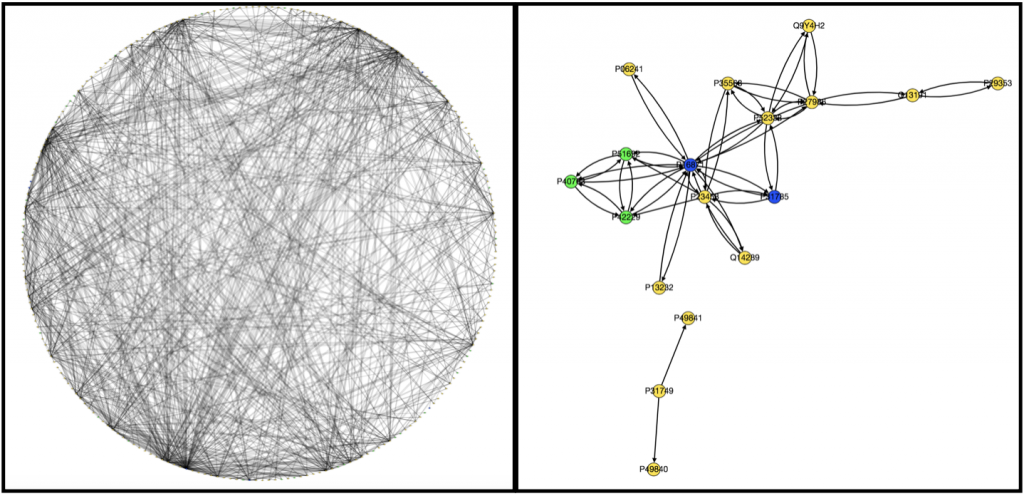
On Monday we all met with Anna to agree on some goals for the week. Kathy and I set out to acheive several things: A. to figure out how to download data from FireBrowse on colon adenocarcinomas, to perform several statistical analyses on that data and to visualize it in some form using pylab, B. to write a code that produced informative graphs of the different signaling pathways from text files containing information about the edges and nodes and C. to implement PathLinker and LocPL and to create graphs of the top k paths on GraphSpace.
Originally to acheive our first goal, we tried to use Nicholas Egan’s pepper pathway code to download and format the data. However, while we were able to decipher how it worked, it ended up not being all that useful to us, so Kathy downloaded all the gene files related to colon adenocarcinoma onto her computer . Unfortunately, we’re still not really sure how to use them. We wrote a code that took text files containing information on edges and nodes and spit out a graph with color-coded nodes that were labeled with the node name and type and edges that were labeled with the type of interaction that was occuring between the two nodes for example “physical” or “phosphorylation”. I have attached to examples of the graphs we produced below, one very complex and the other very simple.

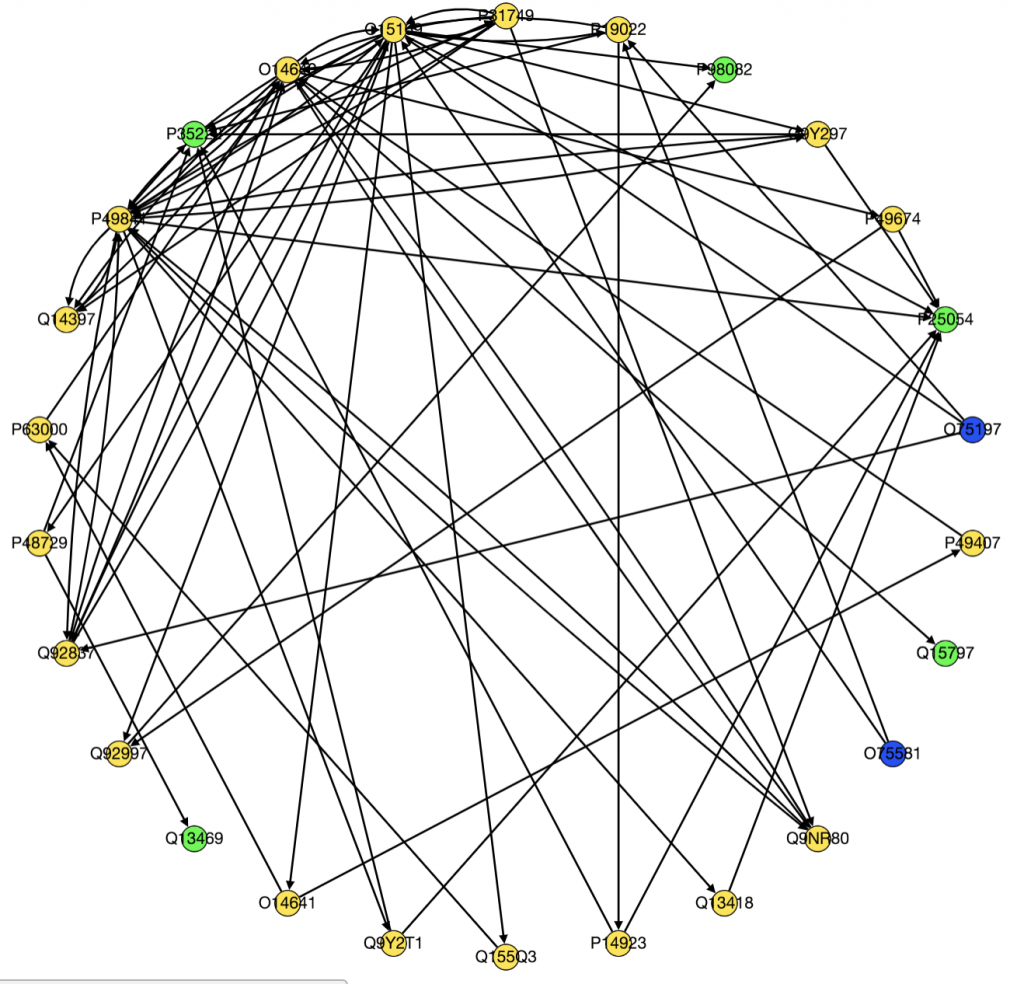
We also ran PathLinker on the Wnt pathway and made a graph of the top 200 best paths produced.

Moving forward we have several goals. Kathy is trying to figure out how to implement LocPL. I am still trying to figure out how to process and use the FireBrowse data. Because I will need to integrate methylation data from FireBrowse in my project, it is essential I figure out how to use it.
Overall, this week I have learned a lot about data processing, writing code to read text files, and using NetPath, PathLinker, FireBrowse, and GraphSpace. These skills should come in handy as I move forward in my project.
