
In my last blog post, I talked about how I was concerned about how small the range of normalized node scores is. This week I’ve been trying to figure out why that is. To do this I’ve been making histograms of each step of the process from foldchange to Xv to Cv. This is an example of that process for one gene:
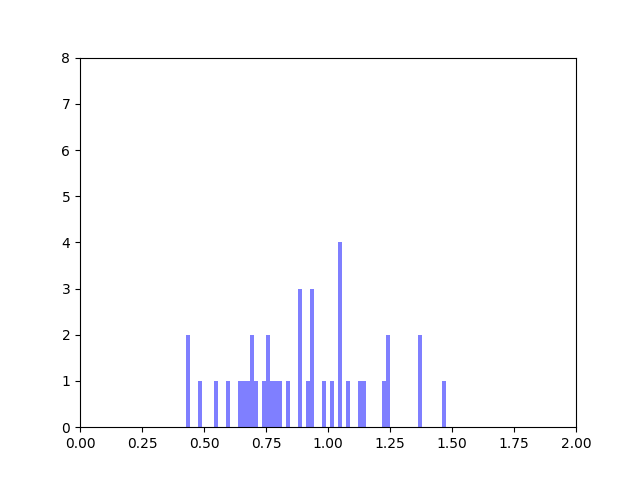
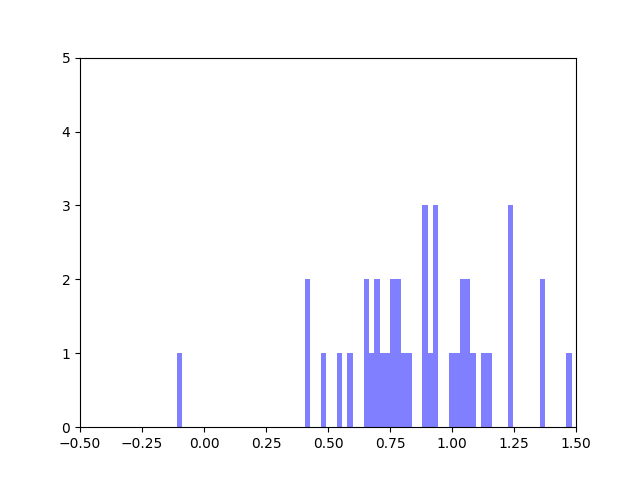
The Cv of the gene above was 0.5000000003. Unfortunately, it looks like a lot of genes even with fairly different fold change and Xv distributions end up with very similar Cvs.
Ibrahim realized that this is occurring because there is an error in the equations we were using so we will have to rethink the way we normalize the data.