
The spring semester starts on Monday and blog posts will resume this coming week!
Author: Alex
Still Winter break
It’s still winter break, and will continue to be for 2 weeks
Week 12
No posts. Thanksgiving week
Week 11
This week, I ran some statistics on how our existing SZ gene dataset fit within the GIANT network. I found that most of our genes had a posterior probability of about 0.3-0.5. Which makes sense, given that many of our genes should be at least 0.2. 
Next/this week is thanksgiving, but soon we’ll be setting parameters for how we want to judge each gene in the completed network given the qualities of the GIANT network as a whole.
Week 10
This week, I got more familiar with the NetworkX package, which is concerned with graph based programming. It’s very powerful, but the complete GIANT network is far too large for it to run efficiently. Even the 0.1 threshold for edges has 41 million edges. However, Anna showed that the number of edges decreases exponentially as the threshold goes up. A careful balance will be needed as for the weight we put on these edges in our final program and how many we include.
Week 9
This week, I compared the brain tissue specific network from human base (http://hb.flatironinstitute.org) with the set of genes I collected associated with a higher risk of schizophrenia. This tissue specific network gives the probability that 2 genes interact with each other specifically in the brain. Genes that interact in regions other than the brain but still interact in the brain have a lower probability count. As expected, nearly all of the associated genes had at least a 0.1 probability, which is relatively high in terms of bioinformatic confidence. Notably, several of the genes interactions that had above a 0.9 probability involved cell adhesion genes.
Of the genes below the 0.1 confidence, most do have neural roles but simply have roles common to other parts of the body. For instance, mir-137 is involved in neural development but is also involved in tumor suppression for several cancers.
This upcoming week, I will be learning how to use NetworkX and will be gathering statistics from the Humanbase network with it.
Week 8
This past week, I created a unified standard for genes. Now regardless of the naming preferences for the genes that various research databases provide, I can now manipulate them as if they were all following the same naming conventions. This resulted in about 10 new genes being added to the gene overlap sets from all the different collections of genes.
This week, I am going to compare all of these genes to that of the GIANT network. That way, we can know where these genes specifically are and what processes they are involved in.
I am also going to be hunting for negatives to compare against for when we build the more complex program. Genes completely uninvolved in Schizophrenia are actually really difficult to find, given that all of the genes I hold in this collection are about 8% of the protein coding genome. I’ll look at computational biology papers associated with mental disorders similar to Schizophrenia, like autism.
Week 7
The week before break, at the group meeting, we discussed the gene lists Miriam and I created. Because of the lack of overlap on my part, my next job to do is to modify my program to account for possible different gene names. Anna sent me a giant text file for it, and I will get it done by the Friday meeting.
I did not spend all of break dormant, and I learned more about bayesian statistics in addition to a brief overview by one of Anna’s post-docs. I think one of the difficulties of knowing how Bayes’ theorem works is the fact that it’s just so ingrained into our normal thought. Given B, what is the probability of A? It’s the probability of B given A times the probability of A divided by the probability of B. The first thing to note is the B denominating the whole equation. The B is accounting for the probability warping from the context of the problem. The second factor is probability of B given A. This represents the relationship we already know. This is multiplied by the probability of A. Therefore, the numerator represents the total probability of B happening because of A, which can also be described as the total probability that the specified relationship happens. By accounting for the probability warping in the denominator, we get the actual probability of A given B.
Bayesian probability is the core of the functional interaction network and the integrated network we will make. I can already kind of see how gene interaction probabilities could be derived from this given interaction data.
However, the mutual exclusivity clause in the theorem might be tricky. I’ll have to closely look at the supplemental data to see how the functional interactive builders accounted for this.
Week 6
Currently on break. Will resume blog posts next week.
Week 5
This week, Anna drafted me to make a program to find the common genes in my schizophrenia dataset. It was a little tricky, given that all of the datasets from the different studies were organized differently, but it wasn’t anything I couldn’t handle.
Legend:
108 LOCI
Schizophrenia Working Group of the Psychiatric Genomics Consortium (2014). Biological insights from 108 schizophrenia-associated genetic loci. Nature 511, 421–427.
SZGENE
Allen, N.C., Bagade, S., McQueen, M.B., Ioannidis, J.P.A., Kavvoura, F.K., Khoury, M.J., Tanzi, R.E., and Bertram, L. (2008). Systematic meta-analyses and field synopsis of genetic association studies in schizophrenia: the SzGene database. Nat Genet 40, 827–834.
HIPSC
Brennand, K.J., Simone, A., Jou, J., Gelboin-Burkhart, C., Tran, N., Sangar, S., Li, Y., Mu, Y., Chen, G., Yu, D., et al. (2011). Modelling schizophrenia using human induced pluripotent stem cells. Nature 473, 221–225.
DEADEXPRESSION
Fromer, M., Roussos, P., Sieberts, S.K., Johnson, J.S., Kavanagh, D.H., Perumal, T.M., Ruderfer, D.M., Oh, E.C., Topol, A., Shah, H.R., et al. (2016). Gene expression elucidates functional impact of polygenic risk for schizophrenia. Nat Neurosci 19, 1442–1453.
CHROMOSOME CONFORMATION
Won, H., de la Torre-Ubieta, L., Stein, J.L., Parikshak, N.N., Huang, J., Opland, C.K., Gandal, M.J., Sutton, G.J., Hormozdiari, F., Lu, D., et al. (2016). Chromosome conformation elucidates regulatory relationships in developing human brain. Nature 538, 523–527.
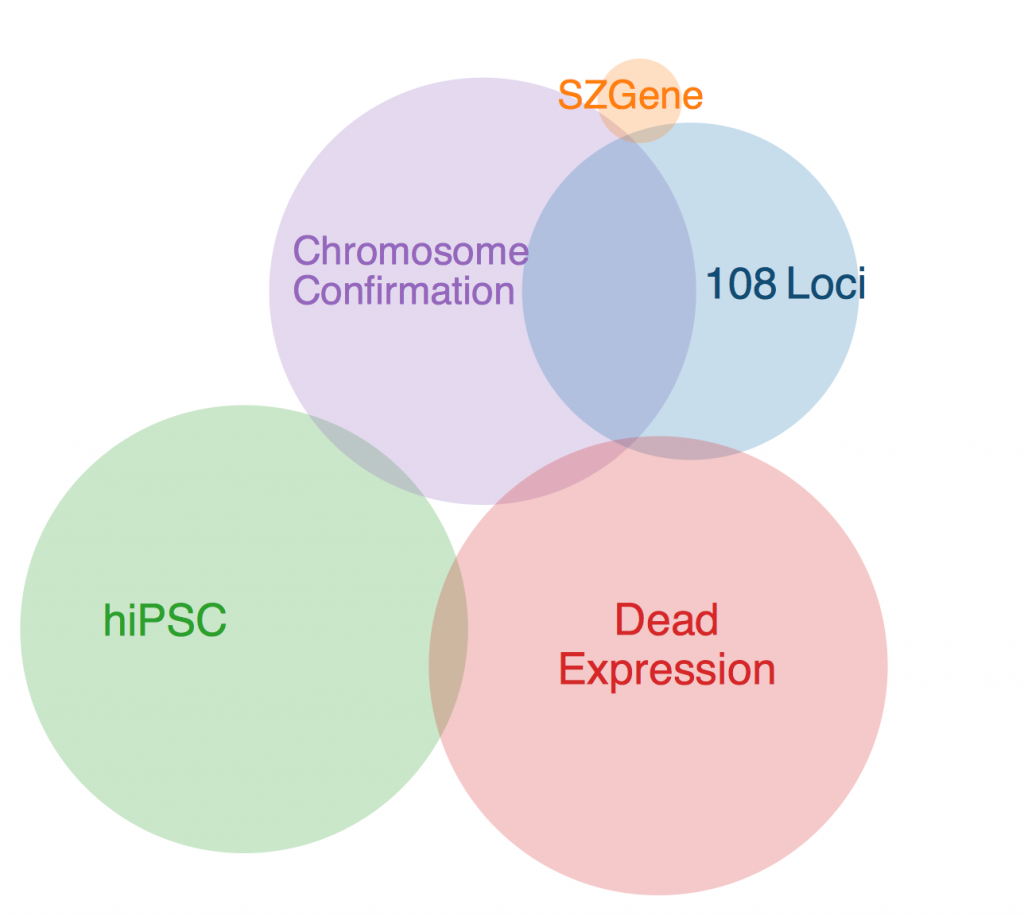
The first thing to note is that there was one gene that was in every data set except SZGene that couldn’t be included in this diagram because the Venn diagram program I found online deemed it geometrically impossible. This gene is TCF4, also known as immunoglobulin transcription factor 2. It is implicated in Pitt-Hopkins Syndrome and is involved in initiating neural differentiation.
An overlap between hiPSC, DeadExpression, and Chromosome Conformation is PRICKLE2, or Prickle Planar Cell Polarity Protein 2. It seems to be involved in the growth of post synaptic densities and neurite outgrowth.
Another pertinent overlap is EFHD1. EFHD1 was found in 108 Loci, hiPSC, and Chromosome Conformation. It seems to be calcium dependent and involved in apoptosis and neural differentiation, and it’s probably mitochondria dependent. However, its family is involved in cytoskeletal rearrangement.
One possibility for the dearth in overlap is simply the diversity in methods. Each collection got its genes from different areas, and it’s very likely that gene expression is totally different in all of these contexts. I’ll probably ask Anna more about this later. Until then, I will restart my Bayesian studies.