Week 7: Matrix Files

This week, I’ve been creating a tabular file with all TCGA-COAD samples at the top of the file as column names, with genes at the sides. I should have a 512 x 60484 matrix file when done. However, with Sol’s help I realized that the file I initially output was actually 512 samples at the top, with only 443 columns after, but still with 60484 lines to the file.

Therefore, I think there’s something wrong in how I’m categorizing/organizing the samples.

Week 4: Parsing Files

This week, I discovered how to download files from the TCGA database, and explored their structure.

So this week, I downloaded 512 files relating to colorectal cancer (COAD in the TCGA database.) These were compressed into a Tar file, which opened into a directory tree that looked like this:


Each tiny blue dot is a folder, and inside each folder is one gzipped file (compressed). And each one of these files is a sample from a patient with gene, and its expression (from either a tumor sample or a healthy one.)

So my main issue has been to try and parse these files into a data matrix, ideally with sample-ids on the top and gene expression on the sides. So far, I’ve been able to compress these files into patient and samples relating to them because ideally, we want to look at gene expression in a healthy and tumor sample from the same patient. However, I haven’t been able to write the sample-ids with gene expression data into a file because of multiple bugs and errors. My goal for next week is to get these errors fixed.

Week 4: Exploring Data

I spent this week developing an understanding of the command line and version control, as well as exploring the data gathered from the TCGA cancer genome data.

First, I discovered that an application I had downloaded to make my life easier (Anaconda) had deleted python 2.7 from my machine and wouldn’t allow me to run things appropriately. This was a huge problem because currently, I need to run programs using python 2.7 and networkx 1.9.1 for dependencies to work out. So, I deleted the installation files and made sure that all of the caches and file folders they resided in were deleted, and then used Homebrew to reinstall python 2 and python 3.  The moral of this story is to always understand what you’re installing.

Secondly, I developed the framework for the bar graph that we will eventually use to analyze which genes are present in each of the datasets we are looking at. We are measuring the number of genes with different levels of gene expression(high, low, or none) in each of the datasets that we have. Each dataset will then have 3 different bars expressing this data.

We’ll be using  the TCGA Genes database,  the number of genes from the PathLinker-2015 interactome, PathLinker-2018 interactome, the Wnt Pathway from NetPath, the PathLinker-2015 interactome’s top 1000 paths, the PathLinker-2018 interactome’s top 1000 paths, and finally the Localized PathLinker-2015 interactome’s top 1000 paths, as well as the Loc_PL 2018 interactome’s top 1000 paths.

Yen’s k shortest paths

This week, we split up to delve further into the PathLinker paper according to our aims. I was assigned to research Yen’s k-shortest paths algorithm and present to the lab on Wednesday.

I’m now going to attempt to explain this algorithm–bear with me.

Some caveats: first, this is an algorithm for computing the k-shortest loopless paths from one node to another, and this algorithm only considers simple paths, where nodes may not be repeated.

To compute the k-shortest paths (where k is a user-defined parameter, say 10 or 4), we first find the shortest path (k=1) using some sort of algorithm, say Dijkstra’s.

Here’s our wonderful graph from Graphspace:
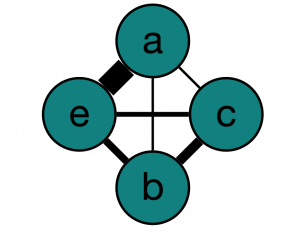
Start Node End Node Weight
a b 1
a c 1
a e 9
b e 3
b c 4
c e 2

So, using our graph, let’s find the shortest path from a to e (P_1). Looking at the graph, we can see that it is a->c->e, with cost 4. Now what we do is loop through all paths using this first path as a guide, because intuitively, there might be some obvious edges that we use in many of the shortest paths.

Let’s call what we’re using from P_1 the root path, and call what we use when we diverge from it the spur path. To find P_2 (the 2nd shortest path), we must go through the graph differently this time to make sure we just don’t get the shortest path again. Because we’re using P_1 as a guide, let’s pretend that the edge from a->c has infinite cost, so that we can never take that edge.

The paths that result from the root path being (a) is then [a ->b->e (4), a->e(9), a->b->c->e(7)].

Then, we expand our root path to be a->c,  and pretend that the edge c->e has infinite cost, so the next path is [a->c->b->e (8)].

We combine the two lists of potential paths and look at their costs. [a->b->e (4), a->e(9),a->b->c->e(7), a->c->b->e(8)]. a->b->e is the 2nd shortest path (P_2)!

Then, we can simply search through the rest of the list for the next shortest path (P_3,…,P_k).


Week 1

Sol, Usman, and I have started working on summer research to modify the PathLinker algorithm.

This week, we plan to finish the code implementing Dijkstra’s algorithm on toy datasets, which was used as a warmup exercise in order to acclimatize us back into working and coding. In addition, I’ve been assigned to understand Yen’s k-shortest paths algorithm, which is one of the foundations of PathLinker.