
We got our program built! It works with the tiny network example that we gave it, with a couple of bugs, which we will fix this week. Also by next week, we will have a preliminary list of candidate genes.
Category: Schizophrenia
Week 14
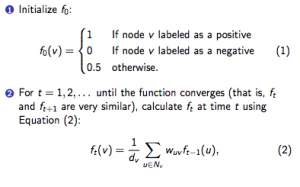
At last week’s meeting, we dug into the computational portion of the project, discussing different ways we could run our algorithm on the gene lists and how that would affect our results. We also discussed a few different methods for running on our gene lists – one method involves a support vector machine and the other is an iterative method of computing scores, shown below.
Biology, 2011.
Alex was able to track down some software for the former method from the autism paper that inspired our project. One of our tasks was to try to get this software to work on our current gene lists – unfortunately, we hit a bit of a wall with this method.
For the second method, we were able to successfully run it on Alex’s gene list. I also had the task of running the iterative method on a small toy example, which was a small graph consisting of 10 nodes, 11 edges, 1 positive, and 1 negative. Anna informed me that when she did it, the scores converged after about 27 time steps, which matches the results that I got. We will go over the results in this week’s meeting and discuss what our goals for this week are.
Week 14
This week, we made our plans and are now coding the program. We hope to have a MVP classifier ready by next week.
Week 13
We’re back!
The main goal for this semester is going to be the implementation of the program and the production of a list of candidate genes.
However, we first need to figure out the best way to build the program. This week, I’m going to gain a deeper understanding of the algorithm that we’re basing our project on. Also, I’m going to try to find some software packages that can help us implement the program, which uses support vector machines. I will also research a possible alternative method that doesn’t use support vector machines: logistic regression. Finally, I will gain more information about the integration of our data sets with the functional interaction network by finding nodes with a high amount of SZ and Focal Adhesion positive neighbors.
The spring semester starts on Monday and blog posts will resume this coming week!
The spring semester starts on Monday and blog posts will resume this coming week!
Still Winter break
It’s still winter break, and will continue to be for 2 weeks
No blog post this week due to winter break!
GIANT Network
This past week I continued looking at the underlying structure of the GIANT network, especially how it changes when we “trim” edges off to make it a more manageable size.
Following up on the path length distribution of the previous week, I calculated this statistic on (almost) all the trimmed networks – from probability thresholds 0.150 to 0.900. The path lengths change as we expected. The first half of the networks have their highest number of shortest path lengths around 3, with the distribution moving outward as the networks get smaller.
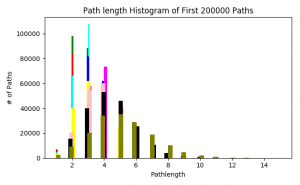
(Color and corresponding probability threshold: Green = 0.150, red = 0.175, cyan = 0.200, blue = 0.300, magenta = 0.400, yellow = 0.500, pink = 0.600, black = 0.700, olive = 0.800, orange = 0.900)
I also did a quick search of the nodes in the networks with the highest degree in order to determine which ones were “hubs” in the network. In the three largest networks, the same gene was the node with the highest degree (ranging from 3283 to 1969 as the trimmed networks got smaller). This gene is called neurotrophic receptor tyrosine kinase 3, or NTRK3.
Another task I was given was to determine shortest paths considering the weights of the edges. There was trick to this – because our most important weights are larger (close to 1) and shortest path algorithms with weights consider lower weight edges, we needed to adjust for this. We agreed to fix this by taking the negative log (base 10) of each probability weight. Since our trimmed networks do not contain edge weights with probability 0, we wouldn’t have to worry about log(0). I am currently working on debugging this code, and will write another post interpreting the results when I have figured this out.
Happy almost end of the semester!!
Week 12
No posts. Thanksgiving week