Weeks 4 and 5: Building a Gold Standard List

Over the past couple of weeks, Alex and I have been given the task of building our project’s gold standard list. This list will be comprised of genes known to be associated with Schizophrenia and genes known to be associated with cell motility; Alex was given the Schizophrenia half to research and I was given the cell motility half. Overwhelmed by the sheer volume of genes and pathways associated with cell motility, I began by looking up genes known to be associated with both Schizophrenia and cell motility. In our meeting, we briefly discussed how this might serve us later as a known positive we could use to test our algorithm.

I read through tons of articles and papers, many of which I found through references in previous papers we have read. In reading these papers, I was hunting for genes, pathways, and resources that were studied and employed by the researchers and found several that will be useful to us. The CAM pathway and associated genes appeared multiple times, and the resource KEGG was used by the majority of the researchers. My task over the past week has been to download data from KEGG, continue accumulating genes for our gold standard list, and begin adding “confidence details” to the genes – this is an important weight that will be added to the genes in our list and will be a measure of how “confident” we are that the gene is truly associated with either Schizophrenia or cell motility.


Week 4

I am currently in the process of figuring out which genes are common to each of the data sets. This will involve building a program to find the common genes. I have a good idea of how to do it; it’s a relatively simple problem. The only hangups will probably be translating all the datasets into one universal comparable format, but given enough time to iron out the kinks in all 5 data sets, I think I can manage easily. Eventually, I’ll make a neat Venn diagram illustrating what genes are common to what datasets.

I’m also learning more and more about bayesian probability. This is the basis of the functional interaction network we will eventually use. Anna’s postdoc Ibrahim explained the basics to me. This is a new concept to me, so this week, I’ll also learn more about that as well.

Week 3

This week, we searched for genes related to both schizophrenia and cell motility in order to build out gold standard of genes upon which to base our program off of.

My job was to find collections of genes related to Schizophrenia (SZ), while Miriam searched for cell motility genes. Our program is planned to have the capability to weight evidence for the strength of the data, so even uncertain genes will be really helpful.

The first set of associated genetic information is from the Schizophrenia Working Group of the Psychiatric Genomics Consortium. In a Genome Wide Association Study (GWAS) from 36,989 cases, they identified 108 loci that contained SNPs significantly more likely to be present in people with SZ. The threshold for significance is a p value of less than 5×10^-8, making this study one of the strongest sets of SZ gene data. However, while most of these SNPs are located near protein coding genes, all but 10 are located within non-coding regions. A regulatory region being near a protein coding gene does not necessarily mean that the gene is actually regulated by that region. Instead, the region might regulate some other gene in some other area. However, regionality with a regulator does imply a higher probability of being regulated by the regulator, so this locational information might be useful in the weaker evidence standards.

http://www.nature.com/nature/journal/v511/n7510/abs/nature13595.html?lang=en

The next set of data is from the Schizophrenia Research Forum on SZGene.org. It contains every genetic association study paper for SZ genes that’s available. It’s a nice collection, but none of the genes reached the GWAS p value threshold of 10^-8. This evidence will have to be weighted proportional to the strength of the studies themselves.

Another set of data comes from an expression study on human induced pluripotent stem cells. The cells were differentiated to neurons and underwent qPCR. This data, however, is in vitro, whereas the developmental aspect of SZ requires a degree of specificity and communication. https://www.nature.com/nature/journal/v473/n7346/full/nature09915.html

There is another gene expression dataset, but this time, it’s from dead people. While the region of the brain is much more specific (prefrontal cortex), this expression data comes long after development. However, they did find 1 gene, inhibited it in a pluripotent stem cell, and found abnormal cell motility. Therefore, this data may be useful to our study. http://www.nature.com/neuro/journal/v19/n11/full/nn.4399.html

The last genetic data set covers the conformational structure of the chromatin in the nucleus. Brain specific intrachromatin contacts can upregulate protein coding genes promoted by the contact. Thus, they established a strong correlation between gene expression and chromatin contact using 3 neonatal brain slices from separate subjects. They were able to locate the points of contact for the remaining 98 loci in the initial gene, giving a more broad picture of genetic interaction. http://www.nature.com/nature/journal/v538/n7626/full/nature19847.html

We’ll probably use all of these data sets. The next question is how.

Week 2

This week we looked at a paper describing the relationship between cellular focal adhesions, cell motility, and schizophrenia. http://www.sciencedirect.com/science/article/pii/S0006322313000917

Previous gene expression assays from olfactory mucosa neurons, which are excellent for disease modeling because of their multipotentcy, from patients with schizophrenia found differential expression in focal adhesion related genes, such as integrin genes (http://dmm.biologists.org/content/3/11-12/785.long). Differential expression was also found in the Focal Adhesion Kinase (FAK) pathway, which is central to the construction and maintenance of Focal Adhesions. Focal Adhesions are necessary for binding the cell to the extracellular matrix, which keeps it lodged in one place. Focal Adhesions are also important for cell motility insofar as cells need some sort of friction to move around. The fatty acid lipid membrane is very flexible and slippery due to its hydrophobicity; it needs the focal adhesions to provide an equal and opposite force for cellular motion. Imagine you’re on an ice rink, but your shoes can penetrate the ice and grip it so that you can walk.

However, these researchers found an increased level of cell motility in neurons of schizophrenic patients. Schizophrenic cells are faster and travel farther than control cells. Schizophrenic cells were also found to be less adherent, with less cells binding to plates when creating cell cultures. They found a reduced level of phosphylated FAK (pFAK) in patient cells but found that inhibiting FAK returned cell motility to control levels. They also found that inhibiting α3β1 integrins and α8β1 integrins also returned motility to normal. This implies that instead of the reduced level of FAK being the cause of the increased motility, the cause is instead a malfunction in the FAK pathway itself, of which α3β1 integrin and α8β1 integrin are a part of. They also found that patient focal adhesions were smaller, less common, and disassembled faster.

Unfortunately, there are an enormous amount of genes involved in cell motility and the FAK pathway. Any one of them could be affecting FAK, integrins, and cell motility at large. Hopefully our functional network programs will help elucidate some suspects.

This coming week, my primary goal will be identifying genes and pathways prominent in Schizophrenia pathology, while Miriam will be finding ones associated with cell motility

Week 2: FAK and Schizophrenia

This week we took a closer look at a paper that investigated cell adhesion, cell motility, and focal adhesion dynamics in Schizophrenia patients.

These migration functions are regulated by focal adhesion kinase (FAK) proteins. The focal adhesion kinase signaling pathway involves the expression of integrin genes; integrins are proteins that detect cell adhesion as well as attach the cell to the extracellular matrix during cell migration. A previous study showed that the expression of two integrin genes (ITGA8, ITGA3) was altered in schizophrenia-derived cells.

The study was conducted on olfactory neurosphere-derived cells (accessible via biopsy of the olfactory mucosa) from 9 healthy male subjects and 9 male schizophrenia patients using two different assays. The assays involved seeding the cells on fibronectin-coated plates or chambers, allowing them to attach for 4 hours, washing away non-adherent cells, and allowing remaining cells to migrate for different periods of time. These experiments were repeated with the presence of FAK phosphorylation inhibitors, and then again while blocking antibodies to two different types of integrins. Several pieces of data were analyzed, including levels of pFAK, migration distance, speed, and size and number of focal adhesions present in the cells.

The results of this study demonstrated several important disparities that we are paying close attention to. While there was no difference in levels of FAK between patients and control subjects, patients had significantly lower levels of phosphorylated FAK (pFAK). In addition, patient cells had fewer adhesions, were less adherent, and were more motile than control cells, with a higher percentage of patient cells migrating further and with greater speed.  When pFAK was inhibited, and antibodies to two different types of integrins were blocked (three separate experiments), patient cell motility was reduced to control levels but control levels were not changed. This last result led us to conclude that the phosphorylation of FAK does not work like an on/off switch; rather, phosphorylation of FAK alters its behavior.

This paper gave us lots of food for thought; it provided us with a starting place to form our list of schizophrenia genes to investigate. Next week we will be investigating cell motility further by finding cell motility gene databases and papers studying the link between cell motility and schizophrenia.


Week 1: A Little Context

Week 1! We’re starting off the year, and our research, with some literature review to provide ourselves with a little context. Our proposed research plan mainly draws on two papers that laid out the methodological groundwork for us.

The first paper provides pertinent results and insights into the connection between cell motility and schizophrenia. The researchers concluded that cells in patients with schizophrenia are less adhesive and more motile than the cells of healthy control subjects, which was shown to improve with the inhibition of the focal adhesion kinase (FAK) protein. The results of this paper showed that there is a correlation between the altered motility of patient cells and dysregulated gene expression in the FAK signaling pathway within these cells. This paper provided us with the informational basis necessary to choose what kinds of genes we will shine our focus on – schizophrenia and migration association genes.

The second paper essentially laid out the framework for our methodology. In this paper, the researchers used a machine-learning algorithm to predict genes associated with autism spectrum disorder (ASD). They then validated these predicted genes experimentally using an independent-case sequencing study and were further able to demonstrate that this large set of ASD genes played roles in key pathways and brain development.

Pulling from both these papers, we plan to develop a network diffusion algorithm to identify candidate schizophrenia and migration associated genes. We are going to computationally build a list of predicted genes and (hopefully) validate them experimentally. However, before we do that, we need to delve into the nitty gritty of how the autism paper’s machine-learning algorithm was created.

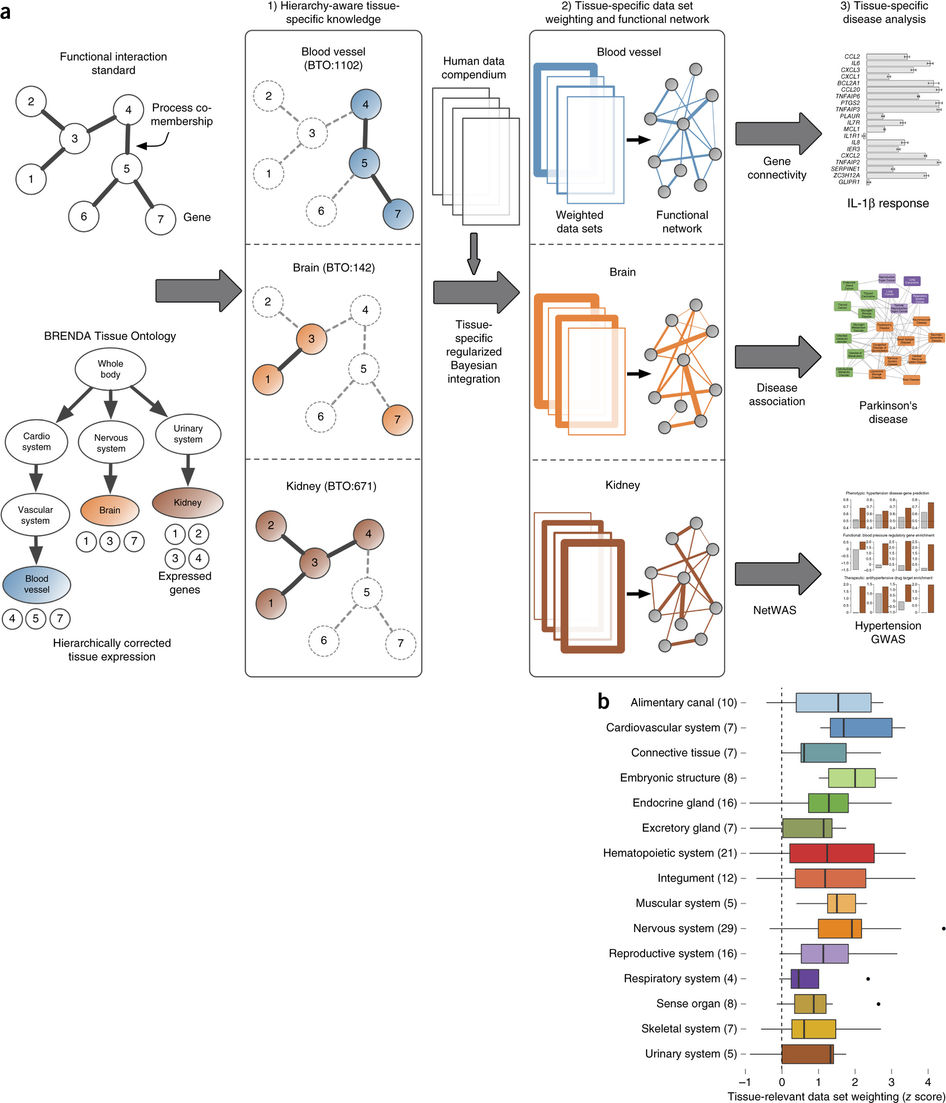
In the paper, it outlines how the approach was based upon a human brain-specific gene functional-interaction network nicknamed GIANT (Genome-scale Integrated Analysis of gene Networks in Tissues). We began with a few initial questions: How is a functional-interaction standard set up? How was GIANT constructed? These questions will no doubt open up a whole new corridor of doors to explore; over the next couple of weeks, our goal is to investigate these questions through literature review and learn more about how we can utilize these tools in the coming year.


9/8/17

9/8/17

We are starting off the year neck deep in our literature review! First, we’re looking at how some researchers built the GIANT network, a functional interaction network built around tissue specificity 1. This type of network would be very useful to us given that we’re looking at neuronal motility genes, which needs to be specific to neurons since a ton of other cells move around.

How to Build a Tissue Specific Functional Gene Interaction Network

  1. Don’t build a tissue specific functional gene interaction network

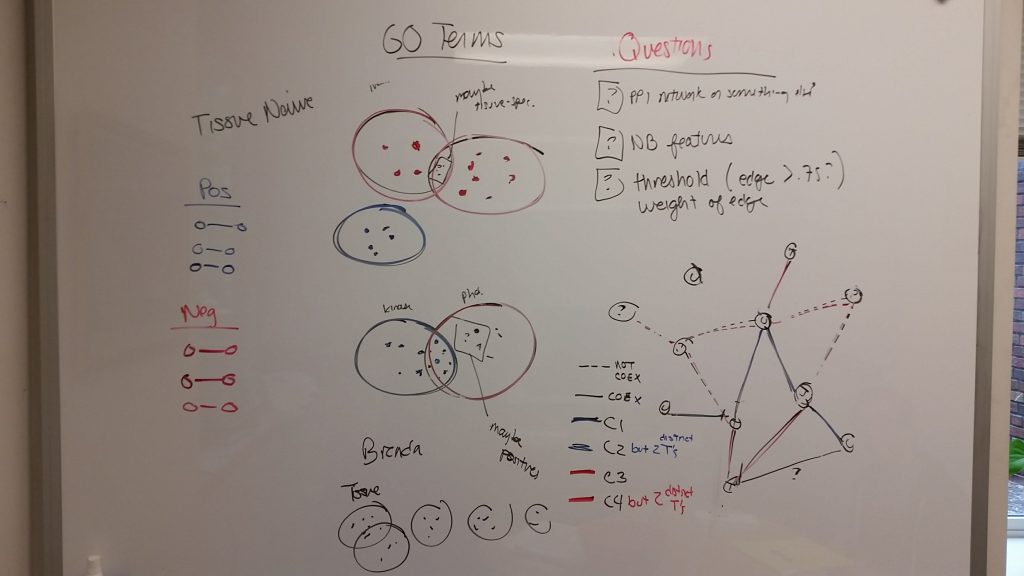
    First, they built a “gold standard” of gene pairs that most definitely not tissue specific by selecting specific biological process gene collections from the Gene Ontology Consortium (GO). Gene pairs that were co-annotated to be functionally related were placed as the positive examples. Gene pairs that were not co-annotated to be functionally related were placed in the not-functionally-related-bin, unless they were: (A) in two different GO groups that had a significant number of shared genes, or (B) if the two genes were in GO groups that had nothing to do with each other. These gene pairs were ignored. They found 604,038 functionally related genes and 12,425,713 unrelated pairs.

  2. Ignore the 13 million pair list you just made

    Next, they matched Human Protein Reference Database gene to tissue annotations to the BRENDA Tissue Ontology. Tissues with less than ten genes were deemed worthless. They then grabbed a separate list of genes that are expressed ubiquitously and removed them from their respective sets of newly categorized genes and placed them into a “ubiquitous” bucket. Thus, they made a set of gene sets of genes expressed exclusively in specific tissues (T) and a set of genes expressed ubiquitously (U).

  3. Integrate the Two lists

    Greene et al, 2015

Going back to the tissue naive list of gene pairs, every gene was labeled depending on its tissue specificity. The gene pairs were then categorized according to each gene’s tissue specificity. The pairs with genes “specifically co-expressed in the tissue [T-T and T-U]” were marked as tissue specific, whereas the remaining gene pairs were marked as negative. The integrations were limited to 144 tissues with at least 10 positive tissue specific gene pairs.

4. Train a Bayesian Classifier for Each Tissue

They also trained a tissue naive classifier using the the original naive pair list. Since there was little independence, which is needed for Bayes classifiers, the dependency was calculated and accounted for. The classifiers then were able to make genome wide predictions about that specific tissue.

Hopefully I can learn more about the nuts and bolts of GIANT. These tools seem incredibly powerful, and might be used to find targets we might have never thought of. I will continue researching throughout the week.

  1. Greene CS, Krishnan A, Wong AK, Ricciotti E, Zelaya RA, Himmelstein DS, Zhang R, Hartmann BM, Zaslavsky E, Sealfon SC, Chasman DI, FitzGerald GA, Dolinski K, Grosser T, Troyanskaya OG. (2015). Understanding multicellular function and disease with human tissue-specific networks. Nature Genetics. 10.1038/ng.3259w. ↩︎

Kicking Off the Collaborative REU

As the summer winds down and classes begin at Reed College, we are excited to begin a new project that sits at the intersection of computer science and biology.  With mentoring expertise on both sides of the aisle (Anna is a computer scientist, and Derek is a cell biologist), our interdisciplinary team will apply computer science techniques to predict potential players in disease.

The Biological Question: How is cell migration regulated in patients with schizophrenia?

Schizophrenia is a psychiatric disorder that affects how a person thinks, feels, and behaves, with potentially severe symptoms.  While we know that susceptibility of this disease runs in families, there are many mysteries about which genes, or “instructions” encoded in DNA, drive schizophrenia.  A paper recently demonstrated that cell migration patterns are altered in patients with schizophrenia – the cells become more motile and less “attached” compared to the same type of cells from healthy patients.  Since genes associated with cell migration have also been implicated in other diseases, we want to identify genes that may be potentially involved in altered cell migration and schizophrenia.

The Computational Approach: Machine learning to predict disease genes

While experiments can test whether a particular gene is associated with cell migration, we can’t simply test all 20,000 possible genes – it would take way too long, be way too expensive, and a vast majority of the experiments will be uninformative.  Instead, we will develop computational approaches to predict a small subset of candidate genes for further experimental testing.  These in silico experiments (which is just a fancy word for computer-simulated experiments) may not be incredibly accurate, but they will sure be fast!

How do we go about developing a computational method to predict candidate cell migration and schizophrenia-associated genes? As we’ll detail in future blog posts, we will search for these genes within large, publicly-available datasets.  We will build a list of the genes that are known to be associated with cell migration or schizophrenia, and then look for other genes that have similar properties to the known genes.  This general technique is called machine learning, where we design instructions for a computer to make predictions.  In our case, we wish to predict whether an unknown gene could be associated with cell migration, schizophrenia, or both.

Experimental Validation: Testing the computational predictions

An important aspect of computational biology research is to experimentally test the predictions to see if we discovered new players involved in schizophrenia and cell migration. In Derek’s lab, the team will test the top candidates in two ways.  First, will see whether each candidate gene affects cell migration in fly cells by “knocking down” the gene product in the cells and observing the change in cell movement.  Next, we will take the top candidates from the first step and observe migration patterns in fly neuroblasts (cells that are destined to become neurons). From these experiments, candidate genes that alter migration patterns in fly neuroblasts may affect neuron cell migration in humans.

There is lots to learn and lots to do!  It will be a fun year – stay tuned.