
My name is Jiarong Li, and I’m a rising junior majoring in Math-CS. In this summer, I’m working on a project related to computational biology with Tunc Kose, Ibrahim Youssef, and Anna Ritz. In the study of protein-protein interactions, we take each protein as a node and the interaction between two nodes as an edge. By building a graph of paths starting from receptors and ending at transcriptional factors, we aim to reconstruct better signaling pathways.
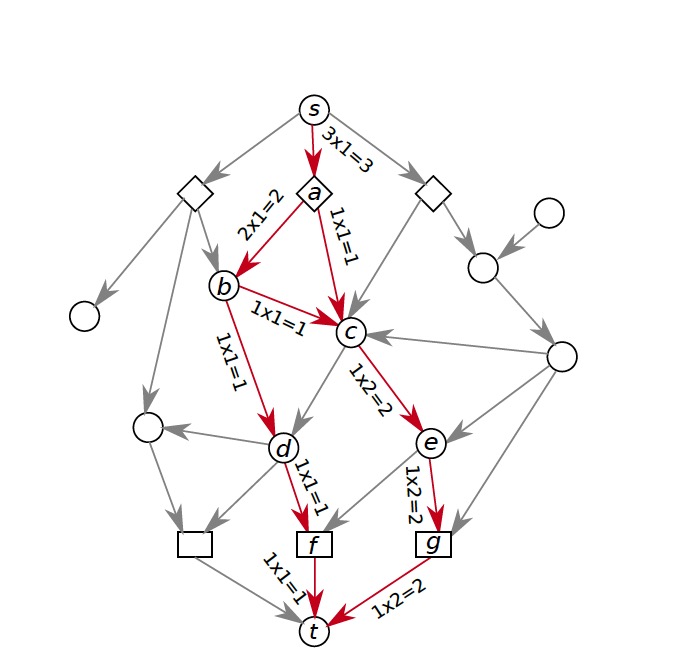
The former method we used to build pathways is PathLinker, which uses k-shortest path (KSP) to get k shortest paths from receptors to transcriptional factors in the collection of protein-protein interactome within a cell. This method, however, reuses a lot of edges and nodes in the process of building the graph. Thus, after a certain point, no new information will be added to the result. In order to solve this problem and get a better reconstruction, we adopt directed acyclic graph (DAG) to grow signaling pathways. DAG is a graph without cycles and all nodes in DAG can be topologically sorted. The algorithm starts from a ‘ground-truth’ graph G_0, which is the first path with more than 2 nodes generated from PathLinker, to grow DAG by introducing a new path that minimizes the total weights of all paths in the graph at every iteration. Here is an example about how the algorithm works.
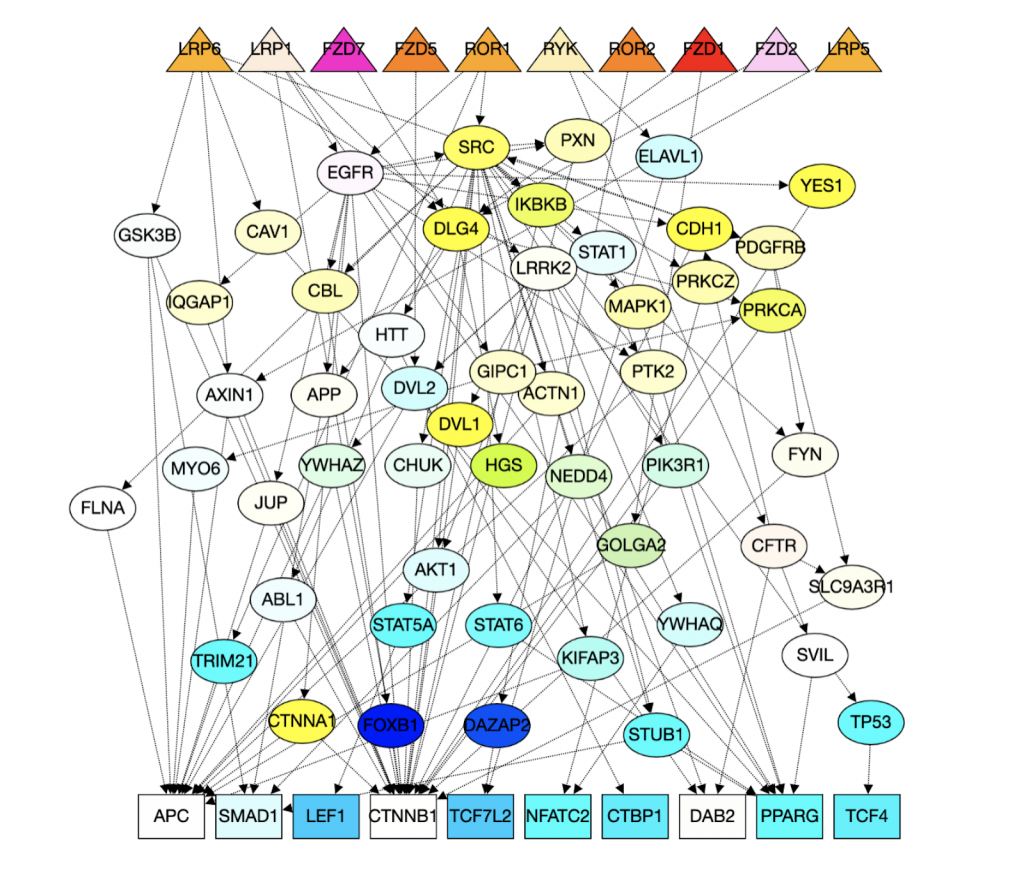
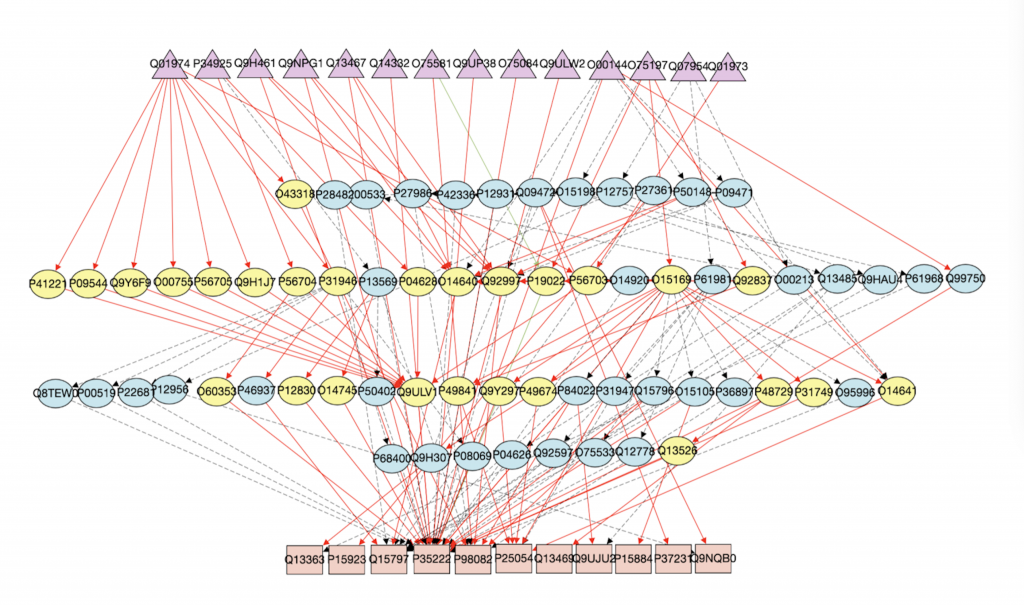
By using the algorithm described above, we get reconstructions of Wnt pathways generated by DAG below. And a graph got from PathLinker for comparison.
http://graphspace.org/graphs/26786?user_layout=6719
As we can see, in the graph generated by DAG, all of the directed edges do not have reverse arrows directions. The triangles are receptors and squares are transcriptional factors. Yellow nodes represent nodes that are in both Wnt pathway and the interactome and blue nodes represent nodes that are only in the interactome.
With these results, we use Precision and Recall to test the performance of DAG. This method shows us the fraction of relevant instances among the retrieved instances and the fraction of relevant instances that have been retrieved over the total amount of relevant instances. Here is graphs of precision and recall for nodes and edges in the reconstruction of RANKL pathway.
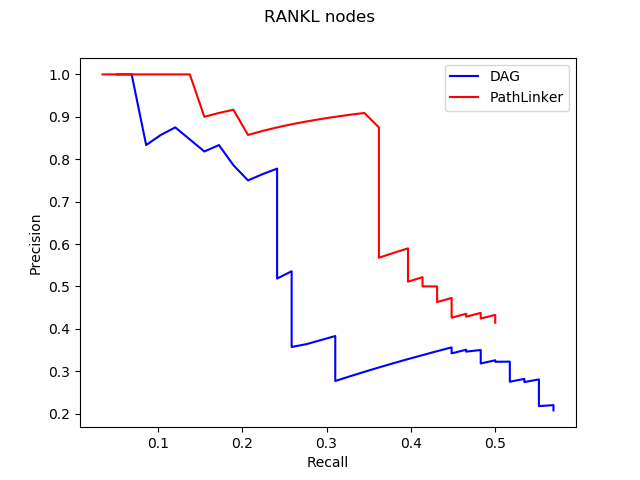
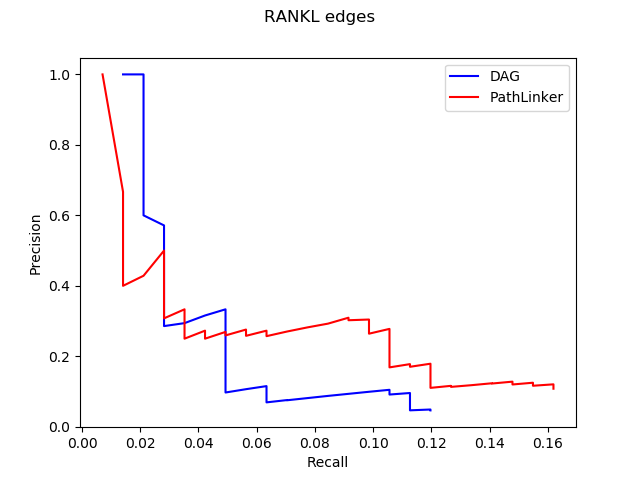
We expect curves to approach to the upper right corner with high precision and recall. However, we cannot really show the obvious advantage of DAG through the this method, which means that we need to explore more ways for testing.
For future researching direction, we are looking for better G_0 options other than the result got from PathLinker. Also, for now, we’re trying adopting different algorithms to grow DAG. Instead of minimizing the total weights of paths in the graph, we’ll minimize the total weights of the graph and compare the result got from different algorithms. Moreover, we realize that there’re certain limits of precision and recall, so we’re looking for a more suitable way to test our current results to show the benefits of the DAG.
Sources:
Ritz, Anna, Christopher L. Poirel, Allison N. Tegge, Nicholas Sharp, Kelsey Simmons, Allison Powell, Shiv D. Kale, and Tm Murali. “Pathways on Demand: Automated Reconstruction of Human Signaling Networks.” Npj Systems Biology and Applications2, no. 1 (2016). doi:10.1038/npjsba.2016.2.
Youssef, Ibrahim, Jeffrey Law, and Anna Ritz. “Integrating Protein Localization with Automated Signaling Pathway Reconstruction.” 2019. doi:10.1101/609149.