More about DAGs

Hi, I am Tunc. If you have read this recent post by Jiarong Li, you might remember that we work on signaling pathway reconstruction. This is a better way of saying that we try to determine the many different orders of protein-protein interactions within a cell, from a receptor to a transcription factor, that make up a pathway. In this post, I want to talk about why and how we have combined PathLinker and our work on Directed Acyclic Graphs (DAGs).

Numbers represent proteins and directed edges represent interactions. PathLinker can find 1->3->4->5 and 2->3->4->5 as two different paths, but only 4 of the 6 edges are unique.
PathLinker can find 1->3->4->5 and 2->3->4->5 as two different paths, but only 4 of the 6 edges are unique. This gets only worse on the larger scale real data.

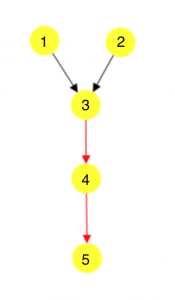
PathLinker can find k-many shortest paths from a receptor to a transcription factor. In our graphs, the length of an edge represents the cost of a protein-protein interaction. We assume that evolutionarily, if an interaction is important for the pathway, it will be optimized to happen easily or have a lower cost, meaning that it will be “shorter”. Hence, one could imagine that the chains of interactions or the paths, that are important for the pathways will be shorter, allowing us to frame the reconstruction problem as a shortest-paths problem. PathLinker can find k-many shortest paths very quickly, where k is user-defined, which is nice. However, as k increases, a lot of these paths start to reuse the same edges over and over again, resulting in a decreased amount of information added.

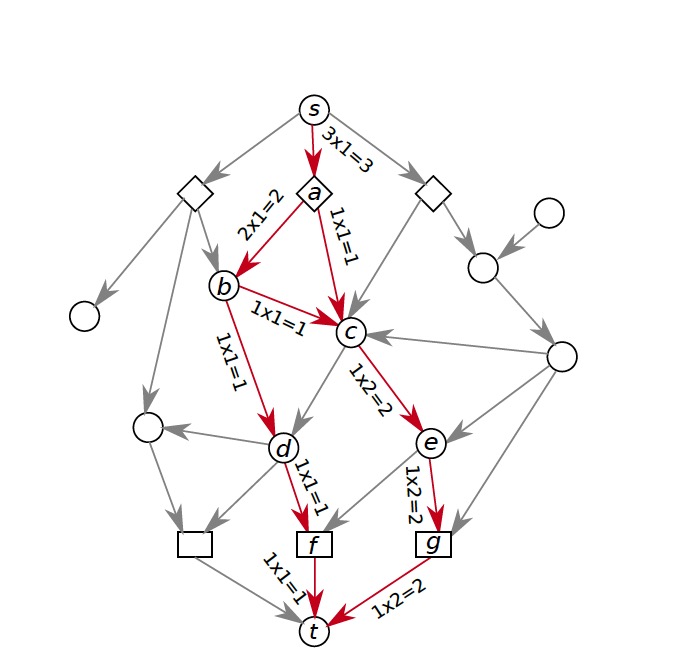
With DAGs, we start with some ground-truth network, find a collection of shortest paths that are not in our network, evaluate them according to some cost function we can customize, pick the path that the cost function thinks is the best, add it to our network and repeat this process many times. This process takes a lot more time than PathLinker and because it has so many parts, changing one thing like the cost function or the ground-truth network can affect the result greatly. This also means that for our program to work properly, we need to be very careful that every part works as we intend it to AND how we intend it to work makes sense biologically.

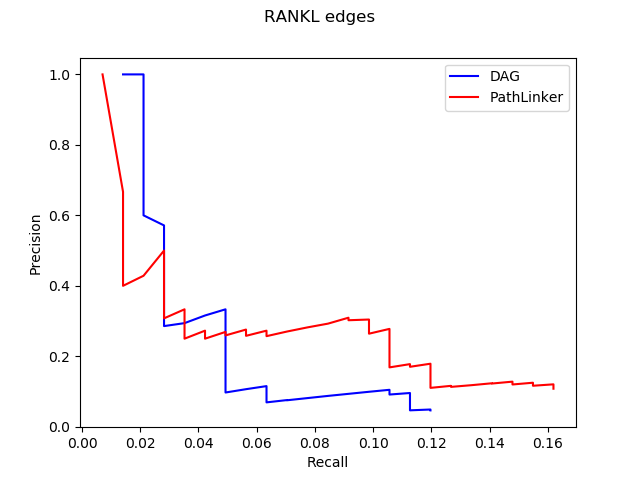
Even though our long term goal might be to get all of those parts working, one quick idea we could try was to impose some of these criteria to the paths PathLinker quickly generates. To do that, we first ran PathLinker to get 50,000 paths, which seemed like a big enough number of paths, and then we wrote a script to iterate over these paths and choose the ‘acceptable’ ones. Here, the definition of acceptable is customizable, and we have tested it with several definitions to observe how our results change.

On the EGFR1 pathway, having a stricter definition of acceptable increased recall with precision being roughly the same for networks created by 1000 acceptable paths.

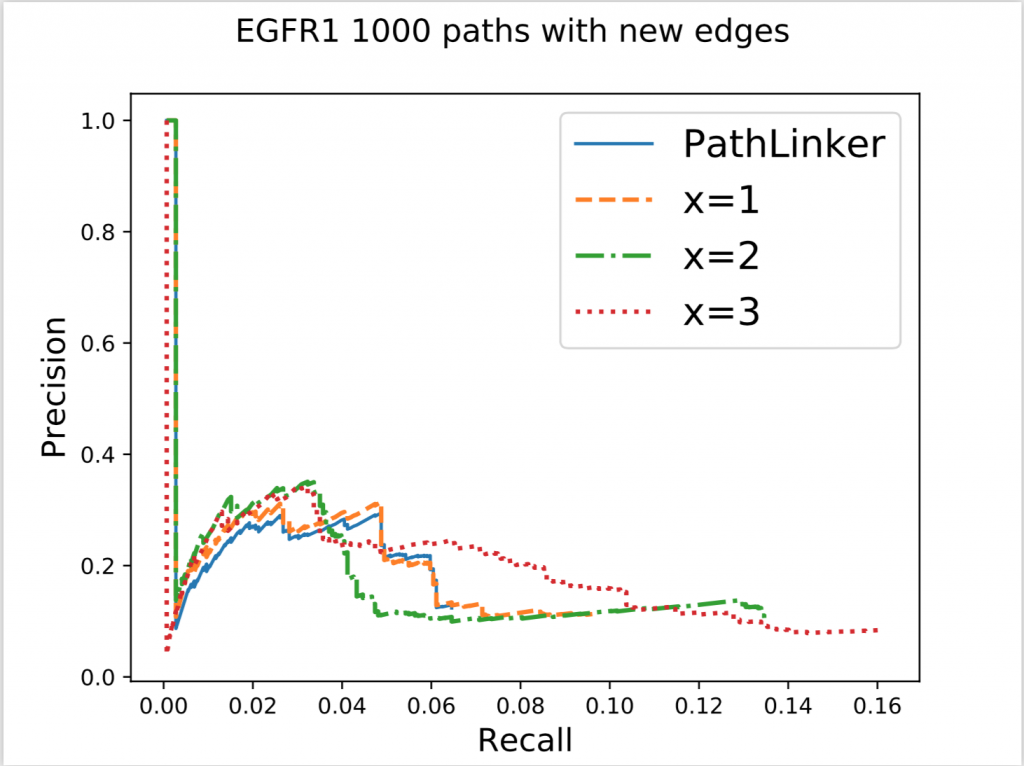
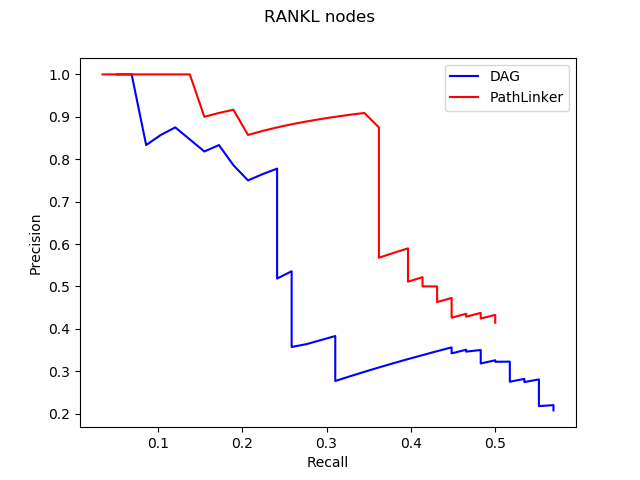
In the figure above, x denotes the minimum number of new edges a path must add for it to be acceptable. Increasing x resulted in an increase of recall without a significant effect on precision. This result wasn’t very surprising because repeated use of false edges does not decrease precision values, each edge is only counted once. Recall increasing also wasn’t very surprising as all we did was to require the addition of new edges, some of which had to be true protein-protein interactions. The real surprising observation we made was when we used this method on different pathways. Epidermal Growth Factor Receptor (EGFR) is a very big pathway, at least in the NetPath database, the other pathways’ data we had were significantly smaller. Consequently, when we used the same method on other pathways, with x = 3 or sometimes even 2, we could never find 1000 acceptable paths. To reiterate, out of 50,000 shortest paths we had originally, there weren’t even 1000 of them that continually added enough new edges to our network. This meant that the reuse of edges in PathLinker was on a very big scale, underlining the potential for our new method.

Reconstructing Signaling Pathways by DAGs

My name is Jiarong Li, and I’m a rising junior majoring in Math-CS. In this summer, I’m working on a project related to computational biology with Tunc Kose, Ibrahim Youssef, and Anna Ritz. In the study of protein-protein interactions, we take each protein as a node and the interaction between two nodes as an edge. By building a graph of paths starting from receptors and ending at transcriptional factors, we aim to reconstruct better signaling pathways.

The former method we used to build pathways is PathLinker, which uses k-shortest path (KSP) to get k shortest paths from receptors to transcriptional factors in the collection of protein-protein interactome within a cell. This method, however, reuses a lot of edges and nodes in the process of building the graph. Thus, after a certain point, no new information will be added to the result. In order to solve this problem and get a better reconstruction, we adopt directed acyclic graph (DAG) to grow signaling pathways. DAG is a graph without cycles and all nodes in DAG can be topologically sorted. The algorithm starts from a ‘ground-truth’ graph G_0, which is the first path with more than 2 nodes generated from PathLinker, to grow DAG by introducing a new path that minimizes the total weights of all paths in the graph at every iteration. Here is an example about how the algorithm works.

By using the algorithm described above, we get reconstructions of Wnt pathways generated by DAG below. And a graph got from PathLinker for comparison.

LocPL Wnt Reconstruction with Compartments
http://graphspace.org/graphs/26786?user_layout=6719
Wnt Pathway reconstructed with DAGs

As we can see, in the graph generated by DAG, all of the directed edges do not have reverse arrows directions. The triangles are receptors and squares are transcriptional factors. Yellow nodes represent nodes that are in both Wnt pathway and the interactome and blue nodes represent nodes that are only in the interactome.

With these results, we use Precision and Recall to test the performance of DAG. This method shows us the fraction of relevant instances among the retrieved instances and the fraction of relevant instances that have been retrieved over the total amount of relevant instances. Here is graphs of precision and recall for nodes and edges in the reconstruction of RANKL pathway.

We expect curves to approach to the upper right corner with high precision and recall. However, we cannot really show the obvious advantage of DAG through the this method, which means that we need to explore more ways for testing.

For future researching direction, we are looking for better G_0 options other than the result got from PathLinker. Also, for now, we’re trying adopting different algorithms to grow DAG. Instead of minimizing the total weights of paths in the graph, we’ll minimize the total weights of the graph and compare the result got from different algorithms. Moreover, we realize that there’re certain limits of precision and recall, so we’re looking for a more suitable way to test our current results to show the benefits of the DAG.

Sources:

Ritz, Anna, Christopher L. Poirel, Allison N. Tegge, Nicholas Sharp, Kelsey Simmons, Allison Powell, Shiv D. Kale, and Tm Murali. “Pathways on Demand: Automated Reconstruction of Human Signaling Networks.” Npj Systems Biology and Applications2, no. 1 (2016). doi:10.1038/npjsba.2016.2.

Youssef, Ibrahim, Jeffrey Law, and Anna Ritz. “Integrating Protein Localization with Automated Signaling Pathway Reconstruction.” 2019. doi:10.1101/609149.

Retinoic Acid, Development, and Motif Finding


My name is Tayla, and I’m a rising junior Biology major working on a research project co-advised by Anna Ritz and Kara Cerveny this summer. Overall, my project is trying to understand a vitamin A-dependent biological signaling pathway that is part of the process of stem cells differentiating into neurons.

We’re interested in this process because previous studies have shown that vitamin A is essential to proper embryonic eye development because it alters gene expression at the transcription level via specialized receptor proteins. Understanding this developmental process will provide insight into the complex differentiation process and identifying the involved genes in silico may open avenues of inquiry for in vivo studies. We hope to search for the genes that are affected by this pathway through sequence analysis and analyze how those genes might fit into this regulatory network.

But first, some background: the pathway that I’m looking at is the retinoic acid pathway which is especially significant in the retina of developing zebrafish embryos. Retinoic acid is an active metabolite of vitamin A that allows proteins to bind to DNA and alter the transcription of certain genes (Figure 1). These proteins, called retinoic acid receptors, alter in the presence of retinoic acid to bind to very specific DNA sequences called retinoic acid response elements (RAREs).

Figure 1. Heterodimerization occurs upon nuclear retinoic acid receptors (RARs) and retinoid X receptors (RXRs) recognizing a tandemly repeated hexad motif called a retinoic acid response element (RARE) usually upstream of the direct target gene. In the presence of retinoic acid (all trans and 9-cis), the complex becomes active. This complex can either encourage transcription of its target gene by cleaving the co-repressors or inhibit transcription through repressor factor recruitment.

One of my goals for this project is to find zebrafish genes that are responsive to retinoic acid influxes. To do this, I have to scan through parts of the genome and look for a tandem repeat of a six base pair motif. Retinoic acid receptors bind to these RAREs within the sequence upstream of the affected gene. I can build a program that takes these upstream regions of zebrafish genes, finds this repeated motif, and tells me all the genes that were found.

Figure 2. The RARE motif is composed of 6 base pairs of conserved sequence followed by a space of 1-5 base pairs and then a repeat of the same motif. The spacing in between motifs is used to classify it; for example the motif in the figure is a direct repeat spaced 5 base pairs apart and would be called a DR5.

While it sounds pretty simple, there are actually a lot of moving parts. First I have to read in a big file of sequence and identifying information, and preferably do it quickly. Then I have to find a six base pair motif repeated 1-5 base pairs downstream and score it according to what’s allowed by its documented variation (Figure 2). Finally I have to return the gene IDs of genes containing the repeat. All of this is run on 65,171 annotated zebrafish transcripts’ upstream regions.

Luckily, at this point in my project (about 6 weeks in), I’ve written a program that will do this in about half an hour. Now comes the interpretation: finding out where and at what stage the genes I identified with my program are expressed in zebrafish. Hopefully we’ll find some genes that we expect to be regulated by retinoic acid in the final set of candidates to validate our method. The most exciting prospect is perhaps finding novel genes regulated by this pathway, or better yet a confirmation that the genes we’re testing in the lab as direct targets of retinoic acid exhibit the canonical response site.

Sources:

Al Tanoury Z, Piskunov A, Rochette-Egly C. Vitamin A and retinoid signaling: genomic and nongenomic effects. J Lipid Res. 2013;54(7):1761-1775. doi:10.1194/jlr.R030833

Cunningham TJ, Duester G. Mechanisms of retinoic acid signalling and its roles in organ and limb development. Nat Rev Mol Cell Biol. 2015;16(2):110-123. doi:10.1038/nrm3932

Lalevée S, Anno YN, Chatagnon A, et al. Genome-wide in Silico Identification of New Conserved and Functional Retinoic Acid Receptor Response Elements (Direct Repeats Separated by 5 bp). J Biol Chem. 2011;286(38):33322-33334. doi:10.1074/jbc.M111.263681

Predki PF, Zamble D, Sarkar B, Giguère V. Ordered binding of retinoic acid and retinoid-X receptors to asymmetric response elements involves determinants adjacent to the DNA-binding domain. Mol Endocrinol. 1994;8(1):31-39. doi:10.1210/mend.8.1.8152429

Ecology Modeling: Thermal Variation and Phytoplankton Fitness

My name is Amy Rose, and I’m a post-bac in Anna’s lab this summer. I graduated last month with an Alt. Biology degree with an emphasis in Computer Science. Taking Anna’s classes in my first two years at Reed was the start of my interest in computational bio. I spent my junior year studying computer science at The University of Sussex, and after this summer I will be starting as a software engineer at Puppet here in Portland.

When it came time to find a thesis project, I thought it would be interesting to explore an area of biology that I hadn’t had time to study while at Reed. I was coadvised by Anna and Sam Fey, who is an ecologist. Sam’s research on thermal variation led me to my project, which focused on modeling the effect of thermal variation on freshwater phytoplankton using real world data.

Phytoplankton are ectothermic, which means that they are not able to regulate their own body temperature. Additionally, due to their small size it is difficult to empirically measure the variance in their body temperature due to movement through thermally variable environments. My thesis began to resolve the impact on movement on body temperature and fitness. In this context, fitness represents the overall change in population size of phytoplankton based on temperature-dependent birth and mortality rates.

Temperature data was collected from Sparkling Lake in Vilas County, Wisconsin at intervals from .5 to 3m throughout the lake with a frequency as high as every minute over a period of 26 years. We interpolated the collected data to fill in estimated temperatures over depths which were not collected, as seen in the figure below.

Interpolation of data across space. Data was collected at discrete intervals, but linearly interpolated to fill in gaps.
Sparkling Lake temperature data from the 1989 season before and after interpolation. The left figure shows the recorded temperatures collected at each measured depth. The right figure was made through interpolating the temperature at each 0.01 meters given the actual data.

We created five algorithms representing different theoretical patterns of phytoplankton movement throughout the water column, which we plotted against the data. This gave us a framework to understand the limits of what body temperatures phytoplankton may be experiencing. The second stage of the project was to plot these simulated body temperatures against a function representing phytoplankton fitness.

This summer, we hope to extend my thesis research over space and time. For my thesis, we focused on a single season, but we’re currently looking at extending the movement algorithms over all 26 years of data. We’re also interested in exploring more datasets sourced from lakes in different geographical locations. Additionally, we’re analyzing the effects of changes to the fitness function.

Summer Research 2019 – here we go!

Reed has finished for the year, but that doesn’t mean that students are done. Last week kicked off a slew of undergraduate researchers doing all kinds of research. In no particular order, here’s a taste of what people will be working on in the compbio lab. Stay tuned for occaisonal group updates.

Math-CS major Jiarong (Lee) Li ’21 and biology major Tunc Kose ’22 are going to develop algorithms to analyze a cell’s response to external signals (called signaling pathways). They will be working to extend ideas based on the original PathLinker paper and Ibrahim Youssef’s Localized-PathLinker paper.

Recent graduate Amy Rose Lazarte ’19 (alt. bio major with a CS emphasis) will continue to develop a resource and modeling framework for understanding the effect of thermal variation on freshwater phytoplankton. Co-advised by ecologist Sam Fey, she has developed a computational pipeline to analyze longitudinal lake temperature data using simulations of phytoplankton swimming strategies.

Biology major Tayla Isensee ’20 is working on identifying targets of retinoic acid signaling in zebrafish eye development. She has a hand in the wetlab work with developmental biologist Kara Cerveny, and she will be building a zebrafish protein-protein interaction network to find potential regulators to test. First, though, she’s going to hunt for retinoic acid response elements (RAREs) in the zebrafish genome to identify direct targets of retinoic acid.

Another recent graduate, neuroscience major Alex King ’19, will be wrapping up his thesis work to build a network that integrates gene, transcript, and protein relationships in order to identify dysregulated pathways in polygenic diseases based on genome-wide association study (GWAS) data.

Biology major Karl Young ’20 will be reading up on computational modeling in neuroscience, and figuring out the intersection of my world (algorithms for biological networks) and neurobiologist Erik Zornik’s world (neural circuits and how they affect behavior).

Last but not least, CS graduate Ananthan Nambiar ’19 will be getting his thesis ready to present as a poster at ISMB/ECCB in Basel later this summer. He modeled proteins as language with the help of his main advisor, natural language processing (NLP) expert Mark Hopkins in CS.