
No blog post this week due to winter break!
GIANT Network
This past week I continued looking at the underlying structure of the GIANT network, especially how it changes when we “trim” edges off to make it a more manageable size.
Following up on the path length distribution of the previous week, I calculated this statistic on (almost) all the trimmed networks – from probability thresholds 0.150 to 0.900. The path lengths change as we expected. The first half of the networks have their highest number of shortest path lengths around 3, with the distribution moving outward as the networks get smaller.
(Color and corresponding probability threshold: Green = 0.150, red = 0.175, cyan = 0.200, blue = 0.300, magenta = 0.400, yellow = 0.500, pink = 0.600, black = 0.700, olive = 0.800, orange = 0.900)
I also did a quick search of the nodes in the networks with the highest degree in order to determine which ones were “hubs” in the network. In the three largest networks, the same gene was the node with the highest degree (ranging from 3283 to 1969 as the trimmed networks got smaller). This gene is called neurotrophic receptor tyrosine kinase 3, or NTRK3.
Another task I was given was to determine shortest paths considering the weights of the edges. There was trick to this – because our most important weights are larger (close to 1) and shortest path algorithms with weights consider lower weight edges, we needed to adjust for this. We agreed to fix this by taking the negative log (base 10) of each probability weight. Since our trimmed networks do not contain edge weights with probability 0, we wouldn’t have to worry about log(0). I am currently working on debugging this code, and will write another post interpreting the results when I have figured this out.
Happy almost end of the semester!!
Week 12
No posts. Thanksgiving week
No post due to Thanksgiving. Posts will continue this upcoming week!
Week 11
This week, I ran some statistics on how our existing SZ gene dataset fit within the GIANT network. I found that most of our genes had a posterior probability of about 0.3-0.5. Which makes sense, given that many of our genes should be at least 0.2. 
Next/this week is thanksgiving, but soon we’ll be setting parameters for how we want to judge each gene in the completed network given the qualities of the GIANT network as a whole.
GIANT Statistics
Computing network statistics on the GIANT network turned out to be somewhat of a challenge! The first hurdle that Alex and I discovered is that the brain-specific network we are working with is enormous, containing around 43 million edges. This network size was simply too big to run any program on efficiently, so Anna stepped in and created a file of “trimmed” networks that we could quickly use for our computations. Essentially, the edges in the network are weighted by a certain probability, so the network was trimmed by choosing a probability threshold; edges with weights less than that probability would not be included in the trimmed network. The largest trimmed network had about 6.4 million edges and a probability threshold of 0.125. I ran my statistics on networks with probability thresholds of 0.150, 0.175, 0.200, and 0.300 to see if there were differences in the statistics and what those differences might reveal about the structure of the network.
The statistics I ran on the trimmed networks were degree distribution, average AND, and shortest path length distribution. The degree distribution is the most straightforward – the degree of a node in a graph is the number of nodes it is connected to, so the degree distribution is a a histogram of the number of nodes in the network with a certain degree. The shape of the curve provides information about the structure of the graph. If you take the log of the degree distribution, a nice downward sloping line tells you that the network is scale-free, meaning its degree distribution follows what is known as the “power law distribution.” Scale free networks generally contain a smaller number of nodes with a high degree and a higher number of nodes with a small degree.
Below is the degree distribution for the trimmed network with a probability threshold of 0.150. All degree distributions calculated on the trimmed networks looked the same.

AND is short for the average neighbor degree – this looks at a node and sees how many neighbors (nodes a node is connected to) its neighbors have. Average AND answers the following question: On average, what is the degree of the neighbors of nodes with a certain degree? This question essentially investigates if there is a pattern in the degree of neighbors of nodes with a certain degree. Once again, the slope of the line reveals a piece of information about the structure of the network. A negative correlation means high degree nodes tend to be connected to low degree nodes, also known as a disassortative network. A positive correlation means high degree nodes tend to be connected to other high degree nodes and low degree nodes tend to be other low degree nodes, also known as an assortative network. The following figure from a paper on biological network connectivity demonstrates this concept quite clearly:

Overall, the average AND plots of the trimmed networks appear to be assortative, though the shape differs slightly. For example, compare the average AND plots of trimmed networks with 0.150 (top), 0.175 (middle), and 0.300 (bottom) threshold probabilities:


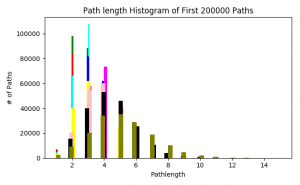
The final statistic is the path length distribution. This statistic is calculated using the breadth-first search algorithm to determine the length of shortest paths between all nodes. However, due to the size of the networks, my program doesn’t look at all possible paths between all nodes, instead running the BFS algorithm twice; once until it hits 100,000 paths and again with 200,000 paths. This was mainly done to see if there was a huge difference in the distribution of path lengths. There is a slight difference, as demonstrated by the distributions of the trimmed network with 0.150 probability threshold:


The next step for this statistic is to normalize the number of paths and see what difference this makes. Over the next couple of weeks, my goal is to refine my positive set of genes and check the GIANT brain-specific network to see if any of these genes appear.
Week 10
This week, I got more familiar with the NetworkX package, which is concerned with graph based programming. It’s very powerful, but the complete GIANT network is far too large for it to run efficiently. Even the 0.1 threshold for edges has 41 million edges. However, Anna showed that the number of edges decreases exponentially as the threshold goes up. A careful balance will be needed as for the weight we put on these edges in our final program and how many we include.
Week 9
This week, I compared the brain tissue specific network from human base (http://hb.flatironinstitute.org) with the set of genes I collected associated with a higher risk of schizophrenia. This tissue specific network gives the probability that 2 genes interact with each other specifically in the brain. Genes that interact in regions other than the brain but still interact in the brain have a lower probability count. As expected, nearly all of the associated genes had at least a 0.1 probability, which is relatively high in terms of bioinformatic confidence. Notably, several of the genes interactions that had above a 0.9 probability involved cell adhesion genes.
Of the genes below the 0.1 confidence, most do have neural roles but simply have roles common to other parts of the body. For instance, mir-137 is involved in neural development but is also involved in tumor suppression for several cancers.
This upcoming week, I will be learning how to use NetworkX and will be gathering statistics from the Humanbase network with it.
Week 8
This past week, I created a unified standard for genes. Now regardless of the naming preferences for the genes that various research databases provide, I can now manipulate them as if they were all following the same naming conventions. This resulted in about 10 new genes being added to the gene overlap sets from all the different collections of genes.
This week, I am going to compare all of these genes to that of the GIANT network. That way, we can know where these genes specifically are and what processes they are involved in.
I am also going to be hunting for negatives to compare against for when we build the more complex program. Genes completely uninvolved in Schizophrenia are actually really difficult to find, given that all of the genes I hold in this collection are about 8% of the protein coding genome. I’ll look at computational biology papers associated with mental disorders similar to Schizophrenia, like autism.
A Quick Update & Overview of Goals
Fall break is over and we’re back to work!
Before break, I found a great resource that summarizes cell motility proteins by grouping them by function; it includes chemotaxis, receptors, growth factors, rho family GTPases, adhesion, integrin-mediated signaling, cellular projections, cell polarity, and proteolysis. This resource constitutes a significant portion of the positive set of proteins involved in cell motility.
Over the past week, I have entered the next step in creating my positive set of proteins known to be participants in cell motility and schizophrenia. Because many papers cited pathways (in addition to specific proteins), it’s crucial to look at these pathways and comb proteins from them to add to the positive set. These pathways, which include the CAM pathway, FAK pathway, and Reelin pathway, were taken from KEGG, a pathway database. Unfortunately, the KEGG pathways download as unreadable XML files, so I must parse these files; I am currently using a parser developed by Anna Ritz. After I have parsed these pathways, my next small step is to see which, if any, proteins are involved in multiple pathways.
Once my positive set has come together, I will begin analyzing the GIANT network. This includes comparing KEGG proteins to the GIANT network as well as generating summary statistics of the GIANT network. I will go into more detail of what this entails as I complete this portion of my analysis, but it will include generating statistics such as degree distribution, average node degree (AND), average AND, and possibly a few others.