Today’s class on electron-deficient atoms and Lewis acids was very informative for me. I want to thank all of the students who were willing to share their questions with me. Your questions are how I learn.
Here are a few post-lecture comments on today’s material that I hope will provide some additional food for thought.
Potential. There is a rigorous, and perhaps needlessly complicated, way to define electrostatic potential. There’s a simple way too. Let’s take the simple way first:
Positive charges create positive potentials and negative charges create negative potentials.
Suppose we have a neutral molecule. Equal number of positive and negative charges inside. If the potential near an atom is positive, the atom carries a partial positive charge. If the potential near an atom is negative, the atom carries a partial negative charge.
How can atoms carry different charges? Simple. Electrons travel between atoms and they may spend more time near some atoms than others. The electron-poor atoms carry a partial positive charge. The electron-rich atoms carry a partial negative charge.
Unfortunately, these simple rules break down for ions because an ion does not contain an equal number of positive and negative charges. The ion’s net charge determines the potential everywhere around the ion. A positive ion creates a positive potential everywhere. An electron-poor atom in a positive ion creates really large positive potentials. These potentials are so large, in fact, that the potential is positive everywhere around the ion, even near the electron-neutral and electron-rich atoms. However, the potential is largest near the electron-poor atom so it is easily identified.
OK, now the complicated definition of potential.
The potential is the potential energy experienced by a +1 point charge.
Some folks have trouble visualizing “potential energy” so it may help to think about work. When you move a particle between positions of different potential energy, you either need to do work or the move can happen spontaneously and energy is released. Unfortunately, mentioning “work” causes its own problems so maybe its best to go back to the simple definition.
Electron-deficient atoms. This is a relative term. For example,
- if an atom is surrounded by fewer than 8 electrons in a Lewis structure, it could be regarded as “electron-deficient”
- if an atom carries a positive formal charge, it could be regarded as ‘electron-deficient”
- if a potential map shows that an atom carries a partial positive charge, the atom could be regarded as “electron-poor” and “electron-deficient”
These definitions can often lead to contradictory conclusions. For example, B in BH3 is electron-deficient in the Lewis octet sense and in the potential map sense, but not in the formal charge sense. O in H3O+ is electron-deficient in the formal charge sense, but not in the octet or potential map sense. And C in H3C+ is electron-deficient in all three ways. When terminology is confusing like this, you need to pay close attention to context.
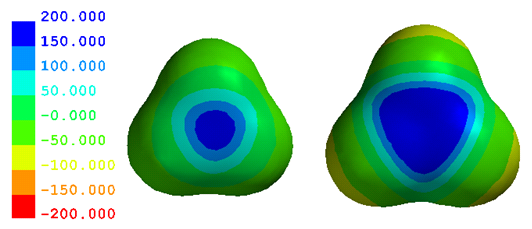
Potential Map Quirks – BH3/AlH3. The blue zones on the BH3 and AlH3 potential maps show that these atoms are electron-poor and (partially) positively charged. Since these are neutral molecules, positive and negative charges must balance. If B and Al are electron-poor and positively charged, the 3 H must be electron-rich and negatively charged. Here are their potential maps.
Do you see what’s wrong? The potentials near H are only a little negative in AlH3 (yellow) and not even that in BH3. This doesn’t seem to make sense, but that’s just because our first conclusion was too simplistic. The charges must balance; but the positive charge on B/Al is balanced by negative charges on three H. So the charge on each H is much smaller in magnitude than the charge on B/Al. This makes the potentials around H must closer to zero.
Two other things to keep in mind. 1) Green may be the most misleading color on any map. While other colors span only 50 kJ/mol of potential, the nearly identical shades of green collectively span 100 kJ/mol. If you look closely you can see the two green zones, but you have to look closely. 2) The molecules are oriented in a way that clearly show the largest potentials near B and Al. This perspective hides the largest potentials near H (notice that you can barely see the yellow zones in AlH3?).

